
8 Web Analytics Dashboards Examples (With SQL)
TL;DR: A good web analytics dashboard answers five questions: how many people came, did they engage, where from, did they convert, and is the site fast. Below are 8 website analytics dashboard examples, each with the query that builds it from the GA4 BigQuery export or your own event tables, so you can rebuild them on your data instead of copying a template screenshot.
Web analytics dashboards are screens that track a website's traffic, engagement, acquisition sources, conversions and performance in one place. Most templates you'll find are images of GA4 or Looker Studio reports. This page goes one layer down: each example lists the tiles, the metric definitions (GA4 counts a session as engaged when it lasts longer than 10 seconds, has a key event, or has 2 or more page views), and the SQL. The queries use the GA4 export table events_YYYYMMDD in BigQuery, plus two Postgres examples for teams that log events in their own database.
What Should a Web Analytics Dashboard Include?
A web analytics dashboard should include five tile groups, one per question:
- Volume: users, sessions, page views, per day.
- Engagement: engagement rate, engaged sessions, engagement time per page.
- Acquisition: source and medium, campaign, landing page.
- Conversion: sign-ups or purchases per session, a funnel from landing to conversion.
- Performance: Core Web Vitals (LCP, INP, CLS) at the 75th percentile.
Pageviews alone tell you almost nothing. The metrics that matter beyond pageviews are engagement rate, conversion rate by source, and landing pages ranked by conversions rather than traffic.
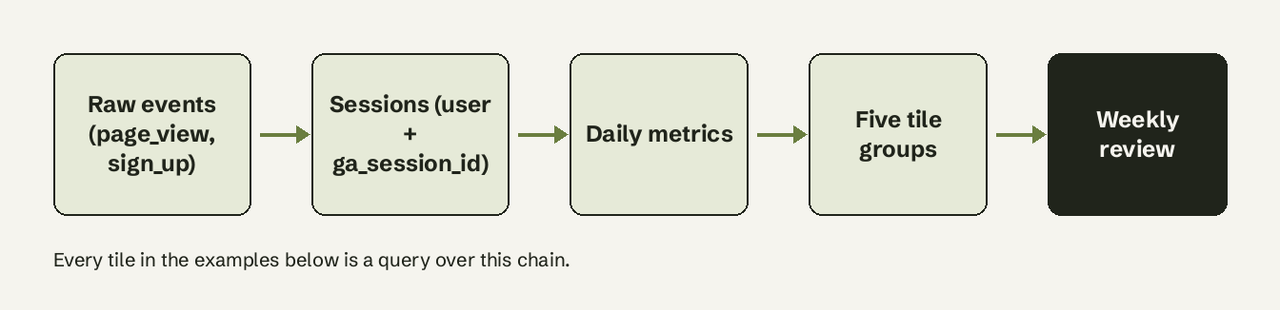
All GA4 examples assume the export is linked and read from the daily tables. Google recommends querying events_YYYYMMDD rather than the intraday table for a stable dataset, and late events can still land in a daily table for up to three days (GA4 BigQuery Export). Replace project.analytics_123456 with your dataset.
1. Traffic Overview Dashboard
Scenario: the founder's morning check. Tiles: users, sessions, engaged sessions and engagement rate per day for the last 28 days.
-- One row per day: users, sessions, engaged sessions, engagement rate
WITH sessions AS (
  SELECT
    PARSE_DATE('%Y%m%d', event_date) AS day,
    user_pseudo_id,
    (SELECT value.int_value FROM UNNEST(event_params) WHERE key = 'ga_session_id') AS session_id,
    MAX((SELECT value.string_value FROM UNNEST(event_params) WHERE key = 'session_engaged')) AS engaged
  FROM `project.analytics_123456.events_*`
  WHERE _TABLE_SUFFIX BETWEEN FORMAT_DATE('%Y%m%d', DATE_SUB(CURRENT_DATE(), INTERVAL 28 DAY))
                          AND FORMAT_DATE('%Y%m%d', DATE_SUB(CURRENT_DATE(), INTERVAL 1 DAY))
  GROUP BY day, user_pseudo_id, session_id
)
SELECT
  day,
  COUNT(DISTINCT user_pseudo_id) AS users,
  COUNT(*) AS sessions,
  COUNTIF(engaged = '1') AS engaged_sessions,
  ROUND(COUNTIF(engaged = '1') / COUNT(*), 3) AS engagement_rate
FROM sessions
GROUP BY day
ORDER BY day;
What it shows: whether a traffic change is real visitors or noise. Bounce rate in GA4 is simply 1 minus engagement rate (GA4 engagement rate and bounce rate), so you don't need a separate tile for it.
Adapt it: add a 7-day moving average column so weekday dips don't trigger panic.
2. Top Landing Pages Dashboard
Scenario: the content lead wants to know which pages start sessions, and which of those sessions engage.
-- Landing page = page_location on the session_start event
SELECT
  REGEXP_EXTRACT((SELECT value.string_value FROM UNNEST(event_params) WHERE key = 'page_location'), r'^https?://[^/]+([^?#]*)') AS landing_page,
  COUNT(*) AS sessions
FROM `project.analytics_123456.events_*`
WHERE event_name = 'session_start'
  AND _TABLE_SUFFIX >= FORMAT_DATE('%Y%m%d', DATE_SUB(CURRENT_DATE(), INTERVAL 28 DAY))
GROUP BY landing_page
ORDER BY sessions DESC
LIMIT 20;
What it shows: your real front doors. On most content sites the homepage is not the top landing page.
Adapt it: join to example 4's conversions to rank landing pages by sign-ups, not sessions.
3. Acquisition Sources Dashboard
Scenario: marketing wants new users by source and medium, to see which channels actually bring people.
-- First-touch source/medium for users first seen in the last 28 days
SELECT
  traffic_source.source AS source,
  traffic_source.medium AS medium,
  COUNT(DISTINCT user_pseudo_id) AS new_users
FROM `project.analytics_123456.events_*`
WHERE event_name = 'first_visit'
  AND _TABLE_SUFFIX >= FORMAT_DATE('%Y%m%d', DATE_SUB(CURRENT_DATE(), INTERVAL 28 DAY))
GROUP BY source, medium
ORDER BY new_users DESC;
What it shows: traffic_source in the export is the user's first-touch source, medium and campaign, not the current session's. Use it for "where do new users come from" and label the tile that way.
Adapt it: group medium into channels (organic, referral, paid, email) with a CASE expression.
4. Conversion Funnel Dashboard
Scenario: a SaaS team tracks landing, pricing page view, sign-up started and sign-up completed.
-- Sessions reaching each step (any order within the session)
WITH s AS (
  SELECT
    CONCAT(user_pseudo_id, '-', CAST((SELECT value.int_value FROM UNNEST(event_params) WHERE key = 'ga_session_id') AS STRING)) AS session_key,
    LOGICAL_OR(event_name = 'session_start') AS landed,
    LOGICAL_OR(event_name = 'page_view' AND (SELECT value.string_value FROM UNNEST(event_params) WHERE key = 'page_location') LIKE '%/pricing%') AS saw_pricing,
    LOGICAL_OR(event_name = 'sign_up_start') AS started,
    LOGICAL_OR(event_name = 'sign_up') AS signed_up
  FROM `project.analytics_123456.events_*`
  WHERE _TABLE_SUFFIX >= FORMAT_DATE('%Y%m%d', DATE_SUB(CURRENT_DATE(), INTERVAL 28 DAY))
  GROUP BY session_key
)
SELECT
  COUNTIF(landed) AS landed,
  COUNTIF(saw_pricing) AS saw_pricing,
  COUNTIF(started) AS started_signup,
  COUNTIF(signed_up) AS signed_up
FROM s;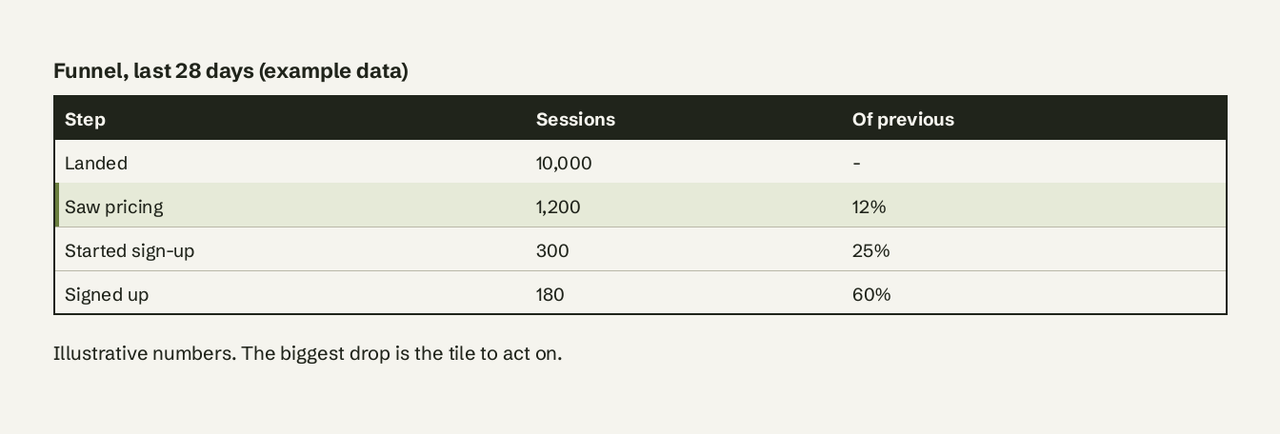
What it shows: where people leave. sign_up is a GA4 recommended event name; sign_up_start is a custom one, so rename it to match your tagging. For more on step design, see our guide to funnel analysis on your database.
Adapt it: enforce step order with event timestamps if your steps can happen out of sequence.
5. Content Engagement Dashboard
Scenario: a blog team ranks articles by how long people actually read, not by views.
-- Average engagement seconds per page view, pages with 100+ views
SELECT
  (SELECT value.string_value FROM UNNEST(event_params) WHERE key = 'page_title') AS page,
  COUNTIF(event_name = 'page_view') AS views,
  ROUND(SUM((SELECT value.int_value FROM UNNEST(event_params) WHERE key = 'engagement_time_msec')) / 1000
        / NULLIF(COUNTIF(event_name = 'page_view'), 0), 1) AS engaged_seconds_per_view
FROM `project.analytics_123456.events_*`
WHERE _TABLE_SUFFIX >= FORMAT_DATE('%Y%m%d', DATE_SUB(CURRENT_DATE(), INTERVAL 28 DAY))
GROUP BY page
HAVING views >= 100
ORDER BY engaged_seconds_per_view DESC;
What it shows: articles that hold attention. A page with modest views and high engaged time is a candidate for more internal links.
Adapt it: filter to one content folder with page_location LIKE '%/blog/%'.
6. Today's Traffic Dashboard (Intraday)
Scenario: launch day. The team wants hourly sessions as they happen.
-- Hourly sessions today, from the streaming table
SELECT
  EXTRACT(HOUR FROM TIMESTAMP_MICROS(event_timestamp)) AS hour_utc,
  COUNT(*) AS sessions
FROM `project.analytics_123456.events_intraday_*`
WHERE event_name = 'session_start'
GROUP BY hour_utc
ORDER BY hour_utc;
What it shows: live momentum. The intraday table needs Streaming export enabled, is best-effort, and is deleted once the day's daily table is complete, so use it for today only. Standard GA4 properties have a 1 million events per day limit on daily export, with no event limit on streaming (BigQuery Export limits).
Adapt it: convert hour_utc to your property's time zone with TIMESTAMP_MICROS(event_timestamp) and DATETIME(..., 'Asia/Kolkata') or your zone.
7. Sign-Ups by Source From Your Own Database (Postgres)
Scenario: you store page_views and users in Postgres, and trust your own sign-up rows more than client-side events.
-- Sign-up conversion by first-touch utm_source, last 30 days
WITH first_touch AS (
  SELECT DISTINCT ON (visitor_id)
         visitor_id, COALESCE(utm_source, 'direct') AS source
  FROM page_views
  WHERE viewed_at >= now() - interval '30 days'
  ORDER BY visitor_id, viewed_at
)
SELECT
  f.source,
  COUNT(*) AS visitors,
  COUNT(u.id) AS signups,
  ROUND(100.0 * COUNT(u.id) / COUNT(*), 2) AS signup_rate_pct
FROM first_touch f
LEFT JOIN users u ON u.visitor_id = f.visitor_id
GROUP BY f.source
ORDER BY signups DESC;
What it shows: conversion rate by channel based on the sign-ups that actually exist in your database. This is the warehouse-based answer to "GA4 says 40 sign-ups, the database says 52." Our conversion rate glossary entry covers the formula choices.
Adapt it: swap users for subscriptions to get paid conversion by source.
8. Core Web Vitals Dashboard (Postgres)
Scenario: engineering logs real-user LCP, INP and CLS from the web-vitals library into a web_vitals table.
-- 75th percentile per metric and device, last 28 days
SELECT
  metric,
  device,
  percentile_cont(0.75) WITHIN GROUP (ORDER BY value) AS p75,
  COUNT(*) AS samples
FROM web_vitals
WHERE recorded_at >= now() - interval '28 days'
GROUP BY metric, device
ORDER BY metric, device;
What it shows: pass or fail against Google's thresholds: LCP within 2.5 seconds, INP of 200 milliseconds or less, CLS of 0.1 or less, measured at the 75th percentile and segmented by mobile and desktop (web.dev Core Web Vitals).
Adapt it: add page_path to the GROUP BY to find the template that fails.
Which Example Fits Your Question?
| You need to know | Use example | Data source |
|---|---|---|
| Is traffic up or down? | 1. Traffic overview | GA4 export |
| Which pages bring people in? | 2. Top landing pages | GA4 export |
| Which channels bring new users? | 3. Acquisition sources | GA4 export |
| Where do visitors drop off? | 4. Conversion funnel | GA4 export |
| What content gets read? | 5. Content engagement | GA4 export |
| How is launch day going? | 6. Intraday traffic | GA4 streaming export |
| Which channels bring real sign-ups? | 7. Sign-ups by source | Your Postgres |
| Is the site fast enough? | 8. Core Web Vitals | Your Postgres |
How Do I Build a Website Dashboard From My Own Data?
To build a website dashboard from your own data, you need three things: events landing in a queryable store, a query per tile, and something that reruns those queries on a schedule.
- Get events into a database. Link GA4 to BigQuery (Admin, BigQuery Links), or log page views and sign-ups to your own Postgres tables.
- Write one query per tile. Start with examples 1, 3 and 7; they answer most weekly questions.
- Pick a renderer. Looker Studio reads BigQuery directly; Metabase and Grafana read Postgres and BigQuery; spreadsheets work for a weekly snapshot.
- Schedule refreshes. Daily is enough for everything except launch-day intraday tiles.
If nobody on your team wants to maintain SQL like the queries above, AI for Database connects to BigQuery or Postgres, lets you ask "sign-up rate by source last 30 days" in plain English, shows the SQL it ran, and pins the answer to a dashboard that refreshes on a schedule. Try AI for Database free at aifordatabase.com. Related reading: GA dashboard templates for SaaS, querying BigQuery without SQL and auto-refreshing dashboard tools.
GA4 vs Warehouse-Based Web Analytics Dashboards: Which Is Better?
GA4's built-in reports are better for quick, standard views with no setup; warehouse-based dashboards are better when you need to join web data with sign-ups, revenue or product usage.
| Criterion | GA4 reports / Looker Studio | Warehouse or own database |
|---|---|---|
| Setup | Minutes | Export link or event logging |
| Joins with sign-ups and revenue | No | Yes |
| Metric definitions | Google's (fixed) | Yours (editable SQL) |
| Data freshness | Near real time | Daily, or streaming |
| Volume limits | Sampling and thresholds in some reports | 1M events/day daily export on standard GA4 |
Privacy-first tools such as Plausible count differently again: no cookies, so one person on two devices is two visitors, and single-page apps need custom events for an accurate bounce rate (Plausible metrics). Never compare numbers across tools without checking definitions first.
Frequently Asked Questions
What should a web analytics dashboard include?
Users and sessions per day, engagement rate, top landing pages, new users by source and medium, a conversion funnel and Core Web Vitals. Keep it to one screen; anything more becomes a report nobody opens.
Which metrics matter beyond pageviews?
Engagement rate, conversion rate by source, sign-ups per landing page and engaged time per page view. These tell you whether traffic is worth anything, which pageviews cannot.
What is a good engagement rate in GA4?
It depends on site type. A GA4 session is engaged if it lasts over 10 seconds, has a key event or has 2+ page views, so content sites with one-page visits score lower than apps. Track your own trend rather than an outside benchmark.
Why don't GA4 and my database agree on sign-ups?
Client-side tags miss users with ad blockers, consent refusals or failed scripts, while your database records every sign-up row. Use your database for conversion counts and GA4 for behavior.
Can I build a web analytics dashboard without GA4?
Yes. Log page views with a visitor ID and UTM parameters into your own table, as in example 7, or use a privacy-first tool like Plausible and export its data.
How often should a website dashboard refresh?
Daily for most tiles. GA4 daily tables can still change for up to three days after the date, so treat the last two days as provisional.