
Dimension vs Metrics: The Difference, in SQL Terms
TL;DR: A dimension is an attribute you group or filter by (country, plan, signup date). A metric is a number you calculate across rows (users, revenue, conversion rate). In SQL, dimensions are the columns in GROUP BY; metrics are the aggregate functions in SELECT.
Dimensions and metrics are the two kinds of fields in every analytics report. A dimension describes something: text or dates such as country, plan or page_path. A metric measures something: a count, sum, average or ratio such as sessions, revenue or churn rate. Google Analytics calls them dimensions and metrics; Looker, Power BI, Tableau and dbt mostly say dimension vs measure. The test that works everywhere: if you would put it in GROUP BY, it's a dimension; if you would wrap it in SUM(), COUNT() or AVG(), it's a metric.
Dimension vs metric at a glance
| Criterion | Dimension | Metric (measure) |
|---|---|---|
| What it is | An attribute that describes rows | A number calculated across rows |
| Typical data type | Text, date, boolean, ID | Number |
| SQL role | GROUP BY and WHERE columns | Aggregates: COUNT, SUM, AVG |
| Examples | country, plan, device, signup_date | users, revenue, orders, avg order value |
| Can you add it up? | No | Usually (except ratios and distinct counts) |
| In a chart | Axis, legend, filter | Bar height, line value |
| GA4 limit (standard property) | 25 user-scoped + 50 event-scoped custom | Custom metrics from numeric parameters |
| Looker | dimension: | measure: |
| dbt Semantic Layer | type: categorical or time | Metrics (measures deprecated in the new spec) |
What is the difference between a dimension and a metric?
A dimension answers "by what?" and a metric answers "how much?". In "revenue by country last month", country is the dimension, revenue is the metric, and last month is a filter on a date dimension.
The Google Analytics Data API defines dimensions as attributes of your data and metrics as quantitative measurements such as users, sessions, conversions and revenue. A report is always some dimensions (the rows) crossed with some metrics (the numbers in each row).
How do dimensions and metrics map to SQL?
Every dimension-and-metric report is one SQL pattern:
-- dimensions: country, plan   metrics: customers, mrr
SELECT
  country,
  plan,
  COUNT(DISTINCT customer_id) AS customers,
  SUM(mrr)                    AS mrr
FROM subscriptions
WHERE status = 'active'
GROUP BY country, plan
ORDER BY mrr DESC;
Dimensions go in SELECT and GROUP BY. Metrics are aggregates in SELECT. Filters on dimensions go in WHERE; filters on metrics go in HAVING, because they only exist after grouping:
-- countries with more than $10,000 in MRR
SELECT country, SUM(mrr) AS mrr
FROM subscriptions
GROUP BY country
HAVING SUM(mrr) > 10000;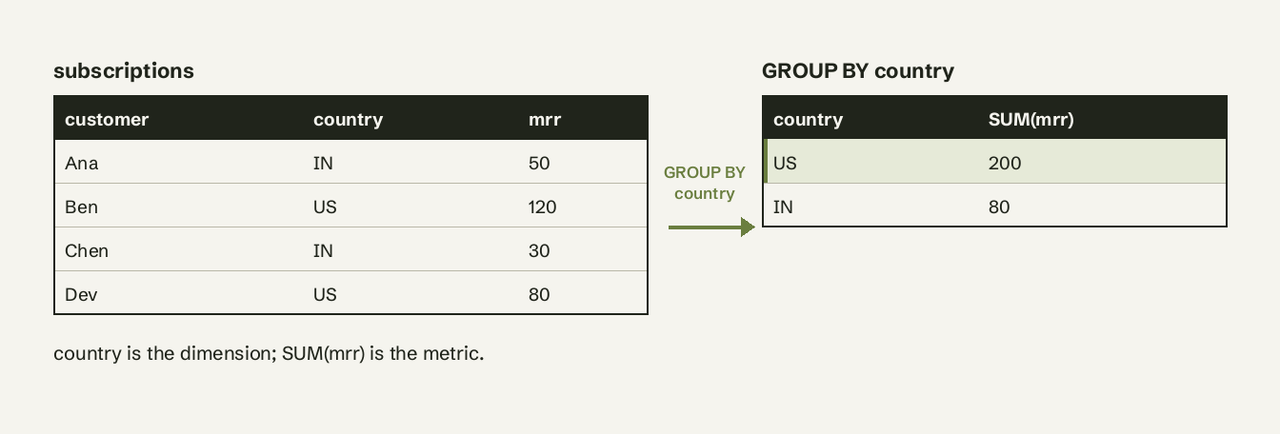
Adding a dimension splits rows further; adding a metric adds a column. That is why the same metric can show different totals in different reports: the dimensions changed the grain.
Is a date a dimension or a metric?
A date is a dimension. You group by it (DATE_TRUNC('month', created_at)) or filter by it; you never sum it. dbt makes this explicit with two dimension types, categorical and time. The confusion comes from date math: "days since signup" is a number, and its average across users (AVG(days_since_signup)) is a metric. The raw date stays a dimension.
The same rule handles IDs. customer_id is a dimension; COUNT(DISTINCT customer_id) is a metric. Numbers aren't automatically metrics: a ZIP code or year is a number you group by, so it's a dimension.
Dimension vs measure in BI tools
"Measure" is the BI-tool word for metric. The idea is the same; the rules differ by tool.
Google Analytics 4
GA4 ships hundreds of built-in dimensions and metrics. A standard property allows 25 user-scoped and 50 event-scoped custom dimensions; custom metrics come from numeric event parameters, and Google advises using dimensions for categorical data. GA4 greys out a dimension or metric that is incompatible with the others in a report, and shows (not set) when no value was sent for a dimension (GA4 help).
Looker (LookML)
Looker separates dimension: and measure: blocks. Aggregate measures (sum, average, count) can reference only dimensions, not other measures, and they are the only measure type that accepts the filters parameter. A measure with no type defaults to string, which surprises people who expected a sum.
dimension: country { sql: ${TABLE}.country ;; }
measure: total_mrr { type: sum  sql: ${TABLE}.mrr ;; }
Power BI
Power BI calls metrics measures, written in DAX (over 200 functions). Drag a numeric column into a visual and Power BI creates an implicit sum for you, which is wrong for things like unit price. Explicit measures avoid that.
dbt Semantic Layer
dbt defines dimensions on columns (categorical or time). Its older measures: block is deprecated in the new spec in favor of simple metrics under the metrics: key, with options such as agg_time_dimension and non_additive_dimension for balances that can't be summed over time. See our comparison of a semantic layer vs metrics layer.
Which metrics can't be added up?
Additive metrics (revenue, orders) sum cleanly across any dimension. Three kinds don't:
- Distinct counts. Users per day don't add up to users per month; a user active on 5 days counts 5 times.
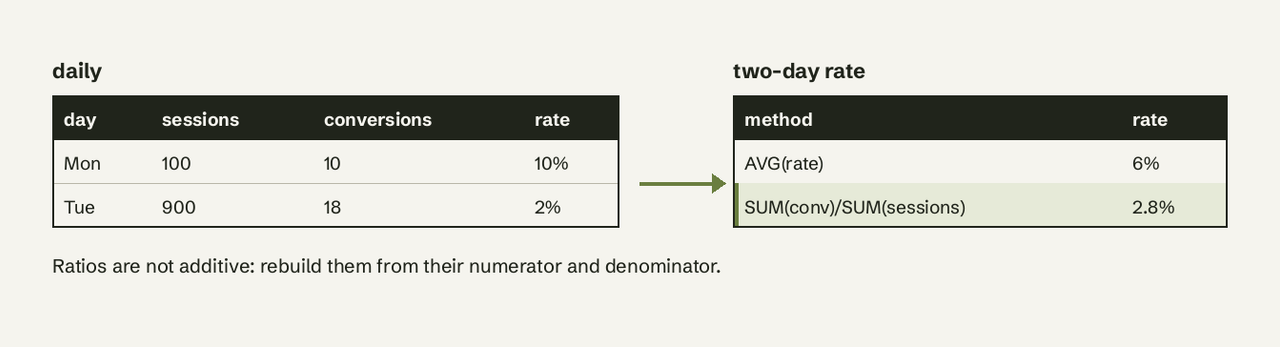
- Ratios and averages. Average the daily conversion rates and you get the wrong monthly rate. Recompute from the parts:
SUM(conversions) / SUM(sessions). - Snapshots. Account balance or MRR at month end can't be summed over months; take the last value. dbt's
non_additive_dimensionexists for this.
Choose a dimension if / choose a metric if
- Make it a dimension if you'll filter by it, group by it, or put it on an axis: plan, country, channel, cohort month, customer ID.
- Make it a metric if it only makes sense aggregated: revenue, sessions, tickets, minutes used.
- Make it both when a number is also a category: store
seatsas a metric (SUM(seats)) and add a bucketed dimension (1-5,6-20,21+) for grouping.
For the metric definitions themselves, see our guides to customer retention metrics, an MRR dashboard, and SQL PARTITION BY for running totals that keep row-level dimensions.
Where AI for Database fits
Once you know which columns are dimensions and which are metrics, most reports are a sentence: "MRR by plan and country for active subscriptions". AI for Database turns that sentence into the GROUP BY query against your own Postgres, MySQL or BigQuery tables, shows you the SQL so you can check the grain, and can pin the result to a dashboard that refreshes on its own.
Frequently Asked Questions
What is the difference between dimensions and metrics in Google Analytics?
In GA4, dimensions are attributes such as page path, country or device category, and metrics are numbers such as active users, sessions and revenue. Every report row is a combination of dimension values with the metrics calculated for it.
Is a dimension the same as a measure?
No. A measure is the BI-tool name for a metric (Looker, Power BI, Tableau). Dimension vs measure is the same split as dimension vs metric.
Can a field be both a dimension and a metric?
The raw field is one or the other, but you can derive both from it. order_total is a metric when summed and becomes a dimension when bucketed into ranges like "under $50".
Why are some dimension and metric combinations not allowed?
They describe different scopes. In GA4 a user-scoped dimension and an event-scoped metric can conflict, so the tool greys out the combination rather than return a misleading number.
Is customer ID a dimension or a metric?
A dimension. Counting it, COUNT(DISTINCT customer_id), produces a metric.