
PostgreSQL EXPLAIN Query Reference: Nodes and Fixes
TL;DR: EXPLAIN prints the plan PostgreSQL will use for a query, with estimated costs and row counts. EXPLAIN ANALYZE actually runs the query and adds real times, row counts and (since PostgreSQL 18) buffer usage. Read the plan bottom-up, find the node where estimated rows and actual rows diverge or where most of the time goes, and use the table below to pick the fix.
A PostgreSQL EXPLAIN query is any statement prefixed with EXPLAIN, for example EXPLAIN ANALYZE SELECT * FROM orders WHERE customer_id = 42;. Plain EXPLAIN only plans the statement and shows estimates: a startup cost, a total cost, estimated rows and row width per node. EXPLAIN ANALYZE executes it and adds actual time, actual rows, loops, Planning Time and Execution Time. Costs are in arbitrary planner units (conventionally disk page fetches), not milliseconds. The nodes you will see most are Seq Scan, Index Scan, Index Only Scan, Bitmap Heap Scan, Nested Loop, Hash Join, Merge Join, Sort and Aggregate; the lookup table below covers each one.
EXPLAIN node lookup table
| Node | What it does | Looks fine when | Slow when | Usual fix |
|---|---|---|---|---|
| Seq Scan | Reads every row of the table | Small table, or query needs most rows | Big table, Rows Removed by Filter is huge | Index the filtered column; run ANALYZE if estimates are off |
| Index Scan | Walks an index, then fetches each row from the heap | Few rows returned | Many rows returned (random heap reads) | Narrow the filter; consider a covering index |
| Index Only Scan | Answers from the index alone | Heap Fetches near 0 | Heap Fetches high | VACUUM the table so the visibility map is current |
| Bitmap Index Scan + Bitmap Heap Scan | Builds a page bitmap from an index, then reads pages in order | Medium selectivity | Recheck Cond removes many rows, lossy blocks | Raise work_mem; a more selective index |
| Nested Loop | For each outer row, probes the inner side | Outer side is small, inner side indexed | loops in the thousands on an unindexed inner side | Index the join key; fix row estimate of the outer side |
| Hash Join | Builds a hash table on one side, probes with the other | Batches: 1 | Batches > 1 (spilled to disk) | Raise work_mem; filter earlier |
| Merge Join | Merges two inputs sorted on the join key | Both inputs already sorted (indexes) | Needs big explicit Sorts below it | Index both join keys |
| Sort | Sorts rows for ORDER BY, DISTINCT, merge joins | Sort Method: quicksort Memory | Sort Method: external merge Disk | Raise work_mem; index matching the ORDER BY |
| Incremental Sort | Sorts groups that are already partly ordered | Used with LIMIT | Many tiny groups | Index on the full sort key |
| HashAggregate / GroupAggregate | GROUP BY via hash table or sorted input | Fits in memory | Spills to disk (Disk Usage) | Raise work_mem; pre-aggregate |
| Limit | Stops after N rows | Low startup cost below it | Sits above a full Sort | Index matching the ORDER BY so the sort disappears |
| Materialize | Caches an inner result for re-reading | Small inner side | Large inner side re-read many times | Rewrite join; better estimates |
| Gather / Gather Merge | Collects rows from parallel workers | Workers Launched equals planned | Fewer workers launched than planned | Check max_parallel_workers_per_gather |
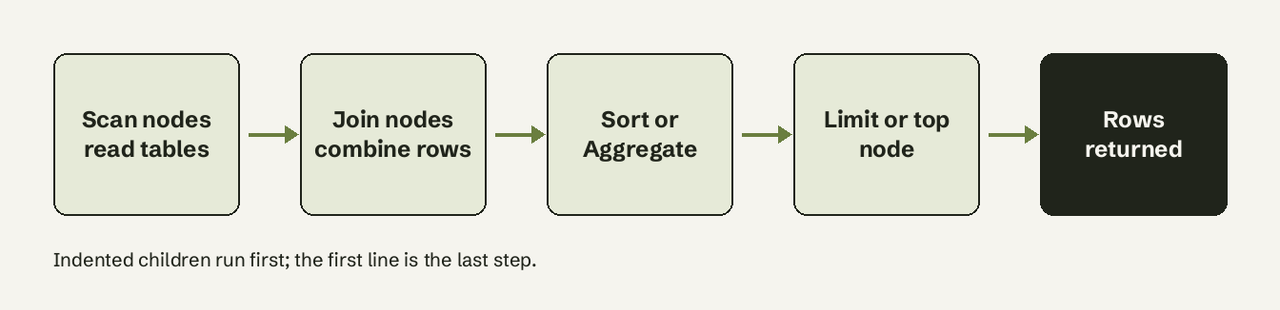
What is the difference between EXPLAIN and EXPLAIN ANALYZE?
EXPLAIN plans the statement and shows estimates only; nothing runs. EXPLAIN ANALYZE runs the statement for real and prints estimates next to what actually happened. That matters for writes: the PostgreSQL docs warn that side effects happen as usual, so test an UPDATE like this:
BEGIN;
EXPLAIN ANALYZE
UPDATE orders SET status = 'archived'
WHERE created_at < now() - interval '2 years';
ROLLBACK;
EXPLAIN ANALYZE also adds profiling overhead, so the docs note it can take noticeably longer than the plain query. If you only need row counts, turn per-node timing off:
EXPLAIN (ANALYZE, TIMING OFF)
SELECT count(*) FROM orders WHERE status = 'paid';
EXPLAIN options reference (PostgreSQL 18)
| Option | Default | What it adds | Needs ANALYZE? |
|---|---|---|---|
ANALYZE | off | Runs the query; actual times, rows, loops | n/a |
VERBOSE | off | Output columns, schema-qualified names, query id | No |
COSTS | on | Estimated startup/total cost, rows, width | No |
SETTINGS | off | Planner settings changed from the default | No |
GENERIC_PLAN | off | Plan for a query with $1 placeholders | Cannot be combined |
BUFFERS | on with ANALYZE (PG18) | Shared/local/temp blocks hit, read, dirtied, written | No |
SERIALIZE | NONE | Cost of converting output to text or binary | Yes |
WAL | off | WAL records, full page images, bytes | Yes |
TIMING | on | Per-node actual time | Yes |
SUMMARY | on with ANALYZE | Planning Time and Execution Time | No |
MEMORY | off | Planner memory use | No |
FORMAT | TEXT | TEXT, JSON, XML or YAML | No |
The combination most people want for a slow read query:
EXPLAIN (ANALYZE, BUFFERS, VERBOSE, SETTINGS)
SELECT c.id, c.email, sum(o.amount) AS revenue
FROM customers c
JOIN orders o ON o.customer_id = c.id
WHERE o.created_at >= now() - interval '30 days'
GROUP BY c.id, c.email
ORDER BY revenue DESC
LIMIT 20;
Use FORMAT JSON when you paste the plan into a visualizer such as explain.depesz.com, explain.dalibo.com (PEV2) or pgMustard.
How do I read cost and rows in EXPLAIN?
Each node line reads (cost=startup..total rows=N width=W). Startup cost is the work before the first row comes out; total cost is the work to return all rows. rows is the estimated output row count and width the average row size in bytes.
The cost is a formula, not a clock. The PostgreSQL manual's own example: a Seq Scan on tenk1 costs 445 because the table has 345 pages and 10,000 rows, and with the defaults seq_page_cost = 1.0 and cpu_tuple_cost = 0.01 that gives 345 × 1.0 + 10,000 × 0.01 = 445. Adding a WHERE filter raises the cost slightly (10,000 × cpu_operator_cost) because every row is still visited.
EXPLAIN SELECT * FROM tenk1;
-- Seq Scan on tenk1  (cost=0.00..445.00 rows=10000 width=244)
With ANALYZE you get a second parenthesis: (actual time=0.017..0.051 rows=10.00 loops=1). Two things trip people up:
- loops: when a node runs more than once (the inner side of a Nested Loop),
actual timeandrowsare per-loop averages. Multiply byloopsfor the real total. An inner Index Scan showingactual time=0.003..0.003 loops=10spent about 0.03 ms in total. - Decimal rows: PostgreSQL 18 prints actual rows with two decimals (
rows=10.00), which makes per-loop averages below 1 visible instead of rounding them to 0.
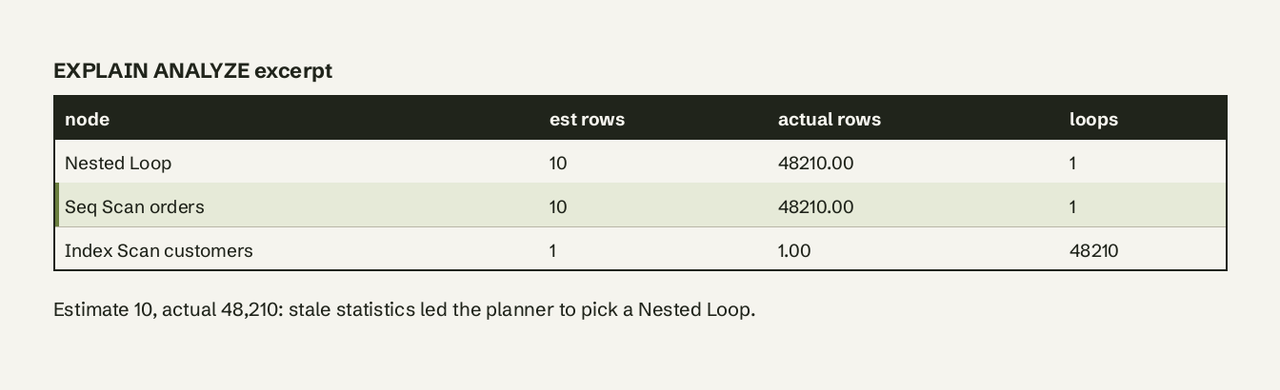
The single most useful habit: compare estimated rows with actual rows node by node. A gap of 10x or more usually means stale or missing statistics. Run ANALYZE orders;, or raise the statistics target on a skewed column:
ALTER TABLE orders ALTER COLUMN status SET STATISTICS 1000;
ANALYZE orders;
Why is Postgres doing a Seq Scan?
A Seq Scan is chosen when the planner estimates it is cheaper than any index path. The common reasons:
- No usable index on the filtered column, or the index does not match the expression (
WHERE lower(email) = ...needs an index onlower(email)). - The query returns a large share of the table. Reading pages in order beats thousands of random index lookups. This is often correct.
- The table is small. A few pages are faster to read whole.
- Bad estimates. Stale statistics make the planner think the filter matches more rows than it does.
- Type or collation mismatch, for example comparing a
bigintcolumn to anumericparameter, orLIKE '%term'with a leading wildcard.
To check whether an index would be used at all, disable seq scans for one session (diagnostic only, never in production config):
SET enable_seqscan = off;
EXPLAIN SELECT * FROM orders WHERE customer_id = 42;
RESET enable_seqscan;
If the plan switches to an Index Scan with a higher cost, the planner was right to prefer the Seq Scan for your data.
What does BUFFERS show?
BUFFERS reports how many 8 kB blocks each node touched. shared hit means the block was already in PostgreSQL's cache; shared read means it had to come from the OS or disk; dirtied and written count blocks changed or evicted by this query; temp read/written means a sort or hash spilled to disk. Counts on a parent node include all its children. Timings for reads appear only when track_io_timing is on.
Hash Join  (actual time=0.515..2.920 rows=100.00 loops=1)
  Buffers: shared hit=437
Since PostgreSQL 18, EXPLAIN ANALYZE includes buffers by default, so you no longer need to remember to add BUFFERS. A high read count on a node that also dominates the time points at I/O: add an index that touches fewer pages, or check whether the working set fits in shared_buffers.
Sort, Hash and memory lines
Sort nodes print the method used. Sort Method: quicksort Memory: 74kB stayed in memory; external merge Disk: ... spilled. Hash nodes print Buckets, Batches and Memory Usage; the docs note that more than one batch means disk was used too. Both are governed by work_mem (default 4 MB). Raise it per session to test:
SET work_mem = '64MB';
EXPLAIN (ANALYZE) SELECT ...;
Index Searches (new in PostgreSQL 18)
Index Scan, Index Only Scan and Bitmap Index Scan nodes now print an Index Searches line with the total number of index descents across all loops. On a Nested Loop's inner index scan with loops=10, you will see Index Searches: 10. A count far above loops hints at array or skip-scan style lookups worth reviewing.
A practical reading order
- Look at
Execution Timeat the bottom. If it is fine, stop. - Find the node with the largest
actual time×loops. - Compare its estimated and actual rows. Big gap: fix statistics first.
- Check
Rows Removed by Filter,Heap Fetches,Sort MethodandBatcheson that node. - Apply the fix from the lookup table, then re-run
EXPLAIN ANALYZEto confirm.
Plan reading is a developer task, but the slow query often sits behind a report that someone outside engineering needs every week. Once it is fast, AI for Database lets that teammate ask for the same numbers in plain English against PostgreSQL, shows the SQL it ran, and can put the result on a self-refreshing dashboard or a Slack alert. Try AI for Database free at aifordatabase.com.
For background, see our glossary pages on query optimization, database indexes and query latency, and our PostgreSQL overview.
Sources: PostgreSQL 18 documentation, EXPLAIN; PostgreSQL 18 documentation, Using EXPLAIN; Planner cost constants.
Frequently Asked Questions
Is EXPLAIN cost in milliseconds?
No. Cost is in arbitrary planner units, conventionally one sequential page fetch equals 1.0. Only EXPLAIN ANALYZE reports real time, in the actual time field and the Execution Time line, both in milliseconds.
Does EXPLAIN ANALYZE change my data?
Yes, if the statement writes. EXPLAIN ANALYZE executes INSERT, UPDATE, DELETE and MERGE for real. Wrap it in BEGIN; ... ROLLBACK; to measure without keeping the changes.
How do I get EXPLAIN output as JSON?
Use EXPLAIN (FORMAT JSON) SELECT ...;. JSON, XML and YAML carry the same information as text and are easier for tools and visualizers to parse.
How do I explain a query with parameters like $1?
Use EXPLAIN (GENERIC_PLAN) SELECT FROM orders WHERE customer_id = $1;. It shows the generic plan without values. It cannot be combined with ANALYZE.
Why does EXPLAIN ANALYZE take longer than the query itself?
Timing every node calls the system clock repeatedly. On queries with many cheap nodes that overhead can be large. TIMING OFF keeps the row counts and total runtime while dropping per-node timing.
Why are the estimated rows so different from the actual rows?
Usually because table statistics are stale or too coarse. Run ANALYZE on the table, and for skewed columns raise the per-column statistics target before analyzing again.