
Pacing Dashboard: 8 Examples With Formulas and SQL
TL;DR: A pacing dashboard shows whether spend (or revenue, or signups) is on track to hit its monthly or flight target, by comparing actual-to-date with expected-to-date. The core formula is pacing % = actual to date ÷ (budget × days elapsed ÷ days in period). Below are 8 pacing dashboard examples, each with the formula and the SQL behind the tile.
A pacing dashboard answers one question every morning: if nothing changes, where will we land at the end of the period? For a $9,000 monthly ad budget on November 12 (12 of 30 days complete), the expected spend to date is $9,000 × 12 ÷ 30 = $3,600. If the campaign has spent $4,140, it is pacing at 115% and will finish near $10,350. A good budget pacing dashboard shows that number per campaign, flags the daily spikes the ad platforms allow, projects month-end spend, and tells you the daily spend needed to land on budget. The same tiles work for revenue and signup targets, which is why the last two examples are not about ads at all.
Most pacing dashboard pages online are Google Sheets or Looker Studio templates that pull from one ad platform. They work until your spend sits in three platforms and your targets sit in a spreadsheet nobody updates. The examples here assume the data lives in a database (Postgres syntax), so every tile is one query you can schedule, chart and alert on.
What is pacing in advertising?
Pacing is the rate at which a budget is spent relative to the time that has passed in its period. A campaign is "on pace" when the share of budget spent matches the share of the period elapsed, "overpacing" when it spends faster, and "underpacing" when it spends slower. Pacing matters because ad platforms do not spend your daily budget evenly:
| Platform | Max spend on one day | Cap over the period | Source |
|---|---|---|---|
| Google Ads | 2x average daily budget | 30.4x daily budget per month | Google Ads Help |
| Meta Ads | daily budget + 75% | 7x daily budget per week | Jon Loomer, Meta UI wording |
| LinkedIn Ads | up to 100% over daily budget | 7x daily budget per week, never over lifetime budget | LinkedIn Help |
Two of these changed and many guides still quote the old rules. Meta raised its daily allowance from 25% to 75% on November 1, 2023. LinkedIn's help page now says daily spend "might be up to 100% higher than the daily budget"; many blog posts still say 50%. And from June 1, 2026, Google paces campaigns with day-of-week ad schedules toward the full 30.4x monthly limit, so a campaign that runs only on weekdays can spend far more per active day than before. Schedules that only switch off certain hours are not affected.
How do you calculate budget pacing?
Budget pacing is actual spend to date divided by expected spend to date, where expected spend is the budget multiplied by the share of the period elapsed.
expected_to_date = budget × days_elapsed ÷ days_in_period
pacing_pct       = actual_to_date ÷ expected_to_date × 100
projected_total  = actual_to_date ÷ days_elapsed × days_in_period
required_daily   = (budget − actual_to_date) ÷ days_remaining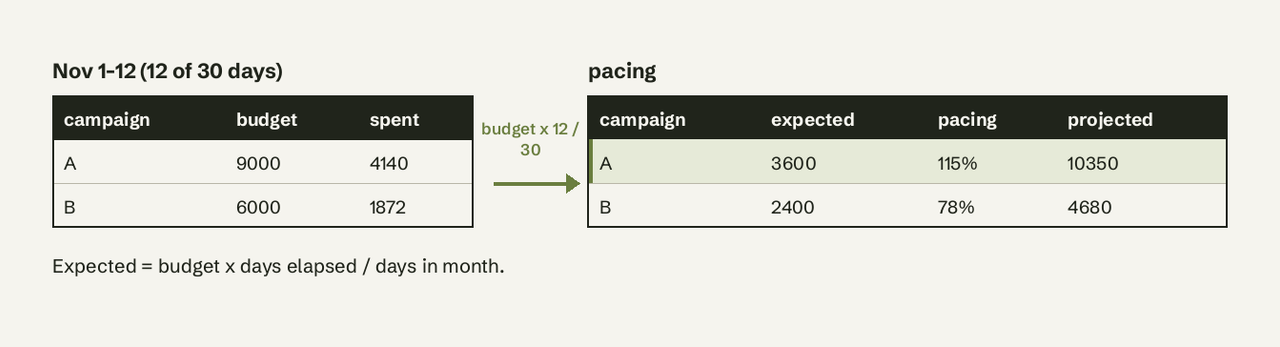
Use the last complete day as "today" (yesterday's date), because most ad platform exports and warehouse syncs land a day behind. The ad pacing formula above is linear. Example 5 shows a weighted version for budgets that should spend more on some weekdays.
The data model behind the examples
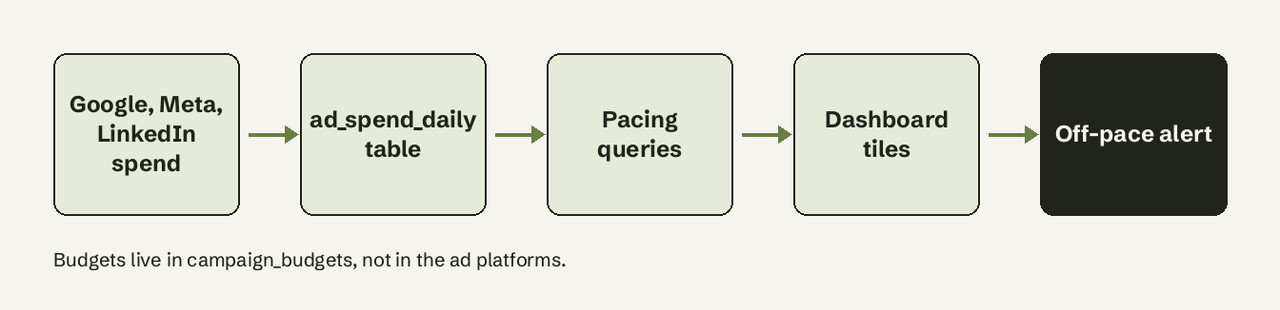
All examples use three tables. Rename columns to match your sync (Fivetran, Airbyte, a platform API script or a CSV import all end up looking like this).
-- one row per campaign per day, from Google, Meta, LinkedIn exports
CREATE TABLE ad_spend_daily (
  spend_date  date,
  platform    text,      -- 'google' | 'meta' | 'linkedin'
  campaign_id text,
  spend       numeric(12,2)
);

-- one row per campaign per month
CREATE TABLE campaign_budgets (
  campaign_id    text,
  platform       text,
  budget_month   date,   -- first day of the month
  monthly_budget numeric(12,2),
  daily_budget   numeric(12,2)
);

-- campaigns with a fixed flight instead of a monthly budget
CREATE TABLE campaign_flights (
  campaign_id   text,
  start_date    date,
  end_date      date,
  flight_budget numeric(12,2)
);
1. Month-to-date pacing by campaign
Scenario: the headline tile. One row per campaign with budget, spend to date, expected spend and pacing %.
-- Month-to-date pacing per campaign (linear)
WITH params AS (
  SELECT date_trunc('month', current_date - 1)::date AS month_start,
         (date_trunc('month', current_date - 1) + interval '1 month - 1 day')::date AS month_end,
         current_date - 1 AS as_of            -- last complete day
),
mtd AS (
  SELECT s.campaign_id, sum(s.spend) AS spend_mtd
  FROM ad_spend_daily s, params p
  WHERE s.spend_date BETWEEN p.month_start AND p.as_of
  GROUP BY s.campaign_id
)
SELECT b.campaign_id,
       b.monthly_budget,
       coalesce(m.spend_mtd, 0) AS spend_mtd,
       round(b.monthly_budget * (p.as_of - p.month_start + 1)
             / (p.month_end - p.month_start + 1), 2) AS expected_mtd,
       round(100 * coalesce(m.spend_mtd, 0)
             / nullif(b.monthly_budget * (p.as_of - p.month_start + 1)
                      / (p.month_end - p.month_start + 1), 0), 1) AS pacing_pct
FROM campaign_budgets b
CROSS JOIN params p
LEFT JOIN mtd m USING (campaign_id)
WHERE b.budget_month = p.month_start
ORDER BY pacing_pct DESC;
What it shows: which campaigns are ahead of or behind the straight line. In Postgres, subtracting two dates returns whole days, so as_of - month_start + 1 is days elapsed (date functions).
How to adapt it: show it as a table with conditional color: green between 90% and 110%, amber outside that, red below 75% or above 125%. Those bands are a starting point, not a standard; tighten them for large budgets.
2. Daily spikes against the platform's daily cap
Scenario: Meta spent $175 on a $100 daily budget and someone asks if that is a bug. It isn't, but you want to see it.
-- Days in the last 14 where spend exceeded 1.5x the daily budget
SELECT s.spend_date, s.platform, s.campaign_id, s.spend, b.daily_budget,
       round(s.spend / nullif(b.daily_budget, 0), 2) AS x_daily_budget,
       CASE s.platform
         WHEN 'google'   THEN 2.00
         WHEN 'meta'     THEN 1.75
         WHEN 'linkedin' THEN 2.00
       END AS platform_daily_cap
FROM ad_spend_daily s
JOIN campaign_budgets b
  ON b.campaign_id = s.campaign_id
 AND b.budget_month = date_trunc('month', s.spend_date)::date
WHERE s.spend_date >= current_date - 14
  AND s.spend > b.daily_budget * 1.5
ORDER BY x_daily_budget DESC;
What it shows: spikes inside the allowed cap (normal platform behavior) versus spend above it, which on Google usually means overdelivery you will not be billed for. Google's Billed cost report shows the difference as served cost minus billed cost.
How to adapt it: a bar chart of daily spend with a reference line at the daily budget and a second at the platform cap.
3. Projected month-end spend
Scenario: finance wants to know the landing number, not the percentage.
-- Month-end projection: spend to date + trailing 7-day average x days left
WITH d AS (
  SELECT date_trunc('month', current_date - 1)::date AS month_start,
         (date_trunc('month', current_date - 1) + interval '1 month - 1 day')::date AS month_end,
         current_date - 1 AS as_of
)
SELECT s.campaign_id,
       sum(s.spend) FILTER (WHERE s.spend_date >= d.month_start) AS spend_mtd,
       round(avg(s.spend) FILTER (WHERE s.spend_date > d.as_of - 7), 2) AS avg_last_7,
       round(sum(s.spend) FILTER (WHERE s.spend_date >= d.month_start)
             + avg(s.spend) FILTER (WHERE s.spend_date > d.as_of - 7) * (d.month_end - d.as_of), 2)
         AS projected_month_end
FROM ad_spend_daily s
CROSS JOIN d
WHERE s.spend_date BETWEEN d.as_of - 30 AND d.as_of
GROUP BY s.campaign_id, d.month_start, d.month_end, d.as_of;
What it shows: a run-rate projection that reacts to recent budget changes faster than the simple actual ÷ days_elapsed × days_in_period formula. Compare it with monthly_budget, and for Google campaigns with the hard ceiling of 30.4 × daily budget.
How to adapt it: a single number tile per channel, with the budget as the comparison value. Google's own budget report draws the same idea: solid line for cost to date, dotted line for forecast, gray line for the monthly limit.
4. Required daily spend to land on budget
Scenario: the campaign is behind on day 18. What daily budget gets it back to plan?
-- Daily spend needed for the rest of the month to hit budget exactly
WITH d AS (
  SELECT date_trunc('month', current_date - 1)::date AS month_start,
         (date_trunc('month', current_date - 1) + interval '1 month - 1 day')::date AS month_end,
         current_date - 1 AS as_of
)
SELECT b.campaign_id, b.daily_budget,
       round((b.monthly_budget - coalesce(sum(s.spend), 0))
             / nullif(d.month_end - d.as_of, 0), 2) AS required_daily
FROM campaign_budgets b
CROSS JOIN d
LEFT JOIN ad_spend_daily s
  ON s.campaign_id = b.campaign_id
 AND s.spend_date BETWEEN d.month_start AND d.as_of
WHERE b.budget_month = d.month_start
GROUP BY b.campaign_id, b.daily_budget, b.monthly_budget, d.month_end, d.as_of;
What it shows: in the worked example, Campaign A has $4,860 left over 18 days, so $270 a day instead of $300. This is the number a media buyer actually types into the platform.
How to adapt it: add a column required_daily / daily_budget; anything above 2 cannot be recovered on Google or LinkedIn without raising the budget, because the platform will not spend more than twice the daily budget in one day.
5. Weekday-weighted pacing curve
Scenario: B2B campaigns spend most on weekdays, so a straight line makes them look behind every Monday and ahead every Friday.
-- Share of the month's expected spend that should be done by yesterday,
-- weighted by the last 8 weeks of spend per weekday
WITH dow_weight AS (
  SELECT extract(isodow FROM spend_date) AS dow, sum(spend) AS w
  FROM ad_spend_daily
  WHERE spend_date >= current_date - 56 AND spend_date < current_date
  GROUP BY 1
),
days AS (
  SELECT d::date AS day, extract(isodow FROM d) AS dow
  FROM generate_series(date_trunc('month', current_date - 1),
                       date_trunc('month', current_date - 1) + interval '1 month - 1 day',
                       interval '1 day') AS d
)
SELECT round(sum(w) FILTER (WHERE day < current_date) / sum(w), 4) AS share_elapsed
FROM days JOIN dow_weight USING (dow);
What it shows: a weighted "share of month elapsed". Multiply it by monthly_budget instead of days_elapsed / days_in_period in example 1. generate_series with an interval step builds the calendar (set-returning functions); isodow returns 1 for Monday through 7 for Sunday.
How to adapt it: compute weights per platform if Meta and Google have different weekly shapes. For Google campaigns with day-of-week schedules, remember the June 2026 change: Google now tries to spend the full monthly limit in the active days, so the curve flattens into fewer, bigger days.
6. Flight (lifetime) budget pacing
Scenario: a six-week product launch campaign with a fixed $20,000 budget, not a monthly one.
-- Percent of flight budget spent vs percent of flight elapsed
SELECT f.campaign_id, f.flight_budget,
       coalesce(sum(s.spend), 0) AS spend_to_date,
       round(100 * coalesce(sum(s.spend), 0) / f.flight_budget, 1) AS pct_budget_spent,
       round(100.0 * (least(current_date - 1, f.end_date) - f.start_date + 1)
             / (f.end_date - f.start_date + 1), 1) AS pct_flight_elapsed
FROM campaign_flights f
LEFT JOIN ad_spend_daily s
  ON s.campaign_id = f.campaign_id
 AND s.spend_date BETWEEN f.start_date AND least(current_date - 1, f.end_date)
WHERE f.start_date < current_date
  AND f.end_date >= current_date - 1
GROUP BY f.campaign_id, f.flight_budget, f.start_date, f.end_date;
What it shows: two percentages side by side. If 40% of the flight has passed and 55% of the budget is gone, the campaign will run dry before the end date. LinkedIn caps lifetime budgets, so an overpacing LinkedIn flight simply stops delivering early rather than overspending.
How to adapt it: a bullet chart per campaign: bar = % budget spent, marker = % flight elapsed.
7. Revenue pacing against a monthly target
Scenario: the same math, pointed at money coming in. A SaaS team keeps a new MRR target per month in a targets (metric, target_month, target) table and wants to know on the 15th whether it will hit it.
-- New MRR booked this month vs target, pacing and projection
WITH d AS (
  SELECT date_trunc('month', current_date - 1)::date AS month_start,
         (date_trunc('month', current_date - 1) + interval '1 month - 1 day')::date AS month_end,
         current_date - 1 AS as_of
),
booked AS (
  SELECT sum(s.mrr) AS new_mrr
  FROM subscriptions s, d
  WHERE s.started_at::date BETWEEN d.month_start AND d.as_of
)
SELECT t.target AS new_mrr_target,
       b.new_mrr,
       round(100 * b.new_mrr / (t.target * (d.as_of - d.month_start + 1)
             / (d.month_end - d.month_start + 1)), 1) AS pacing_pct,
       round(b.new_mrr / (d.as_of - d.month_start + 1)
             * (d.month_end - d.month_start + 1), 2) AS projected_new_mrr
FROM d
CROSS JOIN booked b
JOIN targets t ON t.metric = 'new_mrr' AND t.target_month = d.month_start;
What it shows: revenue pacing for founders and RevOps, the same tile structure as ad spend. Revenue tends to bunch at month end in sales-led teams, so pair it with the weighted curve from example 5 built on last quarter's daily bookings. For the metric itself, see our MRR dashboard guide and revenue forecasting from your database.
How to adapt it: swap subscriptions for a deals table with closed_at and amount for sales quota pacing.
8. Signup pacing with an off-pace alert
Scenario: a growth team targets 600 signups this month and wants a message when yesterday's pace slips, not a dashboard someone has to remember to open.
-- Returns a row only when month-to-date signups are below 90% of pace
WITH d AS (
  SELECT date_trunc('month', current_date - 1)::date AS month_start,
         (date_trunc('month', current_date - 1) + interval '1 month - 1 day')::date AS month_end,
         current_date - 1 AS as_of
),
pace AS (
  SELECT (SELECT count(*) FROM users u
          WHERE u.created_at::date BETWEEN d.month_start AND d.as_of) AS signups_mtd,
         round(600.0 * (d.as_of - d.month_start + 1) / (d.month_end - d.month_start + 1)) AS expected_mtd
  FROM d
)
SELECT signups_mtd, expected_mtd
FROM pace
WHERE signups_mtd < 0.9 * expected_mtd;
What it shows: nothing on a good day, one row on a bad one. That shape is exactly what a threshold alert needs: schedule it after your nightly sync and send the row to Slack or email.
How to adapt it: move the 600 into the targets table so the alert doesn't need editing every month.
Writing and scheduling these eight queries is the part teams skip. If your spend, subscriptions and signups already sit in Postgres, MySQL or BigQuery, AI for Database lets you ask "which campaigns are pacing above 110% this month?" in plain English, shows the SQL it ran, pins the answer to a self-refreshing dashboard and sends an alert when a pacing query returns a row. Try AI for Database free at aifordatabase.com; sample data is included.
What should a pacing dashboard show?
A pacing dashboard should show, per campaign or target: the budget, actual to date, expected to date, pacing %, projected end-of-period total, and the daily amount needed to land on target. Add one view of daily spend against the platform's daily cap so spikes are explained, not escalated. Keep it to one screen; anything that needs scrolling to find the red rows is a report, not a pacing dashboard. If you are building the wider marketing view around it, our guides to tracking campaign performance from your database and marketing analytics without SQL cover the ROAS and CAC side.
Use this table to pick the tiles:
| You need to know | Use | Chart |
|---|---|---|
| Is each campaign on budget this month? | 1. Month-to-date pacing | Table with colored pacing % |
| Why did spend jump yesterday? | 2. Daily spikes vs platform cap | Bars with budget and cap lines |
| Where will we land? | 3. Projected month-end | Number tile vs budget |
| What should the daily budget be now? | 4. Required daily spend | Table |
| Are weekday-heavy campaigns really behind? | 5. Weighted pacing curve | Line: actual vs weighted expected |
| Will a fixed flight run dry early? | 6. Flight pacing | Bullet chart |
| Will we hit the revenue target? | 7. Revenue pacing | Number tile + projection |
| Tell me when pace slips | 8. Signup pacing alert | Alert, no chart |
Frequently Asked Questions
What is pacing in advertising?
Pacing is how fast a campaign spends its budget compared with how much of the budget period has passed. A campaign that has spent 40% of its monthly budget 40% of the way through the month is on pace; spending faster is overpacing, slower is underpacing.
How do you calculate budget pacing?
Divide actual spend to date by expected spend to date, where expected spend = budget × days elapsed ÷ days in the period. $4,140 spent against a $9,000 budget on day 12 of 30 gives expected $3,600 and pacing of 115%.
What is a good pacing percentage?
There is no official standard. Many teams treat 90% to 110% as on pace and investigate outside that band, and tighten the band near month end when there is less time to correct.
Why does Google Ads spend more than my daily budget?
Google can spend up to twice the average daily budget on a single day to catch high-traffic days, but you will not be billed more than 30.4 times the daily budget in a month. Since June 1, 2026 this monthly target also applies to campaigns that only run on certain days of the week.
Does Meta or LinkedIn overspend the daily budget too?
Yes. Meta may spend up to 75% over the daily budget on a given day and LinkedIn up to 100%, and both cap weekly spend at seven times the daily budget. LinkedIn never exceeds a lifetime budget.
How often should a pacing dashboard refresh?
Daily is enough for most budgets, because ad platform cost data is usually final a day later. Refresh after your nightly sync and use yesterday as the "as of" date so partial days don't make every campaign look behind.