
7 Live Dashboard Examples (With SQL and Refresh Intervals)
TL;DR: A live dashboard is a dashboard that re-runs its queries automatically, so the numbers stay current without anyone clicking refresh. The hard part is not the chart, it is picking the right refresh interval per metric: orders and errors every minute, signups every 15 minutes, revenue and churn hourly or daily. With AI for Database you build each tile by asking a plain-English question about your own database, and the dashboard refreshes itself on a schedule.
Try AI for Database free at aifordatabase.com: start with sample data.
A live dashboard (also called a real-time dashboard or live KPI dashboard) shows metrics that update on their own, either on a fixed interval such as every 5 minutes or on every page view. Most "live" dashboards are not truly streaming: they re-query the database on a schedule. That is fine for almost every business metric, as long as the interval matches how fast the number changes and how fast someone can act on it. The seven live dashboard examples below each list the scenario, the tiles, the Postgres query behind the main tile, and the refresh interval that makes sense.
What Is a Live Dashboard?
A live dashboard is a screen of metrics whose queries re-run automatically at a set interval, so viewers always see recent data. Tools implement it differently:
- Metabase lets you auto-refresh a dashboard at 1, 5, 10, 15, 30 or 60 minute intervals, and every refresh re-runs all queries on the dashboard (Metabase docs). Adding
#refresh=60&fullscreento the URL turns any screen into a wall display that updates every 60 seconds. - Grafana does not auto-refresh by default; you pick an interval, or "Auto", which scales the refresh with the time range and the window width (Grafana docs).
- Power BI limits import-mode semantic models on shared capacity to 8 scheduled refreshes per day, and 48 per day on Premium, PPU or Fabric capacity (Microsoft Learn).
- Looker Studio refreshes Google marketing connectors such as Google Analytics and Search Console every 12 hours, a rate you can't change (Looker Studio Help).
So "live" ranges from every few seconds to twice a day depending on the tool. Our glossary entry on dashboard auto-refresh covers the mechanics in more detail.
How AI for Database Builds Self-Refreshing Tiles
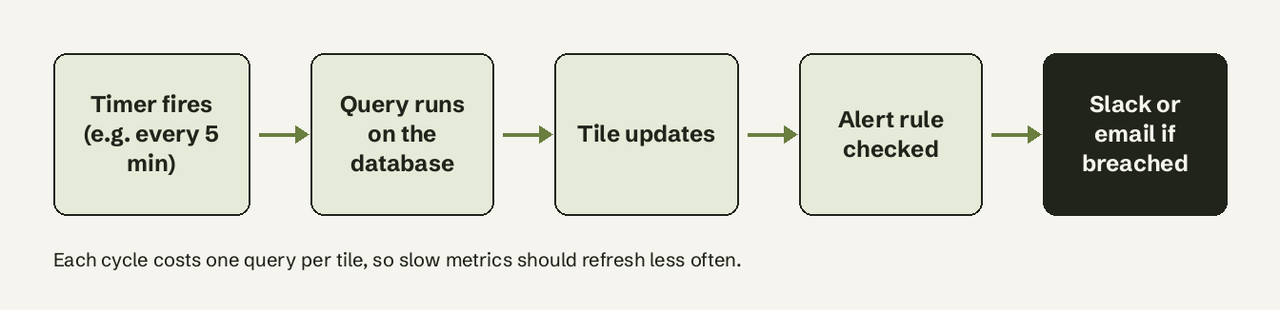
AI for Database connects to PostgreSQL, MySQL, SQL Server, Supabase, BigQuery, MongoDB and other sources, read-only. You build a tile by asking a question such as "Show me orders per minute for the last hour". It writes the SQL, runs it, shows the result with its SQL, and you pin it to a dashboard. The dashboards are self-refreshing: they re-run on a schedule, so nobody re-runs reports by hand.
Two things matter for the examples below:
- Every tile shows its SQL, so an engineer can check the query you get from a plain-English question. The SQL in this article is the kind of query you would see.
- Action workflows watch the same data. You can define a condition ("when daily signups drop below 50") and an action (Slack alert, email or webhook). A live dashboard is only useful when someone is looking at it; an alert covers the hours when nobody is.
Pricing: start free with sample data, then 100 free queries on your own database; Pro is $10 per user per month (pricing, read 2026-10-23).
How Often Should Each Metric Refresh?
A live dashboard should refresh as often as someone can act on the change, and no faster. Use this table as a starting point:
| Example | Main metric | Refresh interval | Why |
|---|---|---|---|
| 1. Live orders | Orders per minute | 1 minute | Checkout outages show up in minutes |
| 2. App errors | Failed jobs, error rate | 1 minute | On-call needs to see spikes now |
| 3. Signups today | Signups vs same time yesterday | 15 minutes | Hourly patterns, slow to act on |
| 4. Support queue | Open tickets, oldest wait | 5 minutes | Staffing decisions within the hour |
| 5. Inventory | Items below reorder point | 1 hour | Reorders take days anyway |
| 6. Revenue (MRR) | MRR, new vs churned | Daily | Changes with billing events |
| 7. Sales pipeline | Deals by stage | 1 hour | Reps update CRM a few times a day |
Every refresh re-runs every query on the dashboard, so a 10-tile dashboard on a 1-minute interval sends 600 queries an hour to your database. Split fast and slow metrics onto separate dashboards rather than refreshing everything at the fastest rate.
1. Orders per Minute During a Sale
Scenario: an ecommerce team watches checkout during a sale. If orders per minute drop to zero, payments are probably broken.
Tiles: orders per minute (last 60 minutes), revenue today, average order value today, orders by payment method.
-- Orders per minute for the last hour
SELECT date_trunc('minute', created_at) AS minute,
       count(*) AS orders,
       sum(total_amount) AS revenue
FROM orders
WHERE created_at >= now() - interval '1 hour'
GROUP BY 1
ORDER BY 1;
Refresh: 1 minute. Adapt it: add WHERE status = 'paid' if failed checkouts are stored in the same table. Pair it with an alert: "when orders in the last 10 minutes = 0 during business hours, post to Slack".
2. Application Errors Dashboard
Scenario: a SaaS team logs background jobs in a jobs table and wants to see failures as they happen.
Tiles: error rate per 5 minutes, failed jobs by type, longest-running job.
-- Job failure rate in 5-minute buckets, last 2 hours
SELECT date_bin('5 minutes', finished_at, timestamptz '2000-01-01') AS bucket,
       count(*) FILTER (WHERE status = 'failed') AS failed,
       count(*) AS total,
       round(100.0 * count(*) FILTER (WHERE status = 'failed') / count(*), 1) AS error_pct
FROM jobs
WHERE finished_at >= now() - interval '2 hours'
GROUP BY 1
ORDER BY 1;
Refresh: 1 minute. date_bin needs PostgreSQL 14 or later; on older versions use date_trunc('minute', ...). Adapt it: for slow queries on SQL Server, see our guide to alerting on long-running SQL Server queries.
3. Signups Today vs Yesterday Dashboard
Scenario: a founder checks if today's launch or campaign is working. Raw counts mislead in the morning; compare against the same time yesterday.
Tiles: signups so far today, signups by this time yesterday, signups by source.
-- Signups today vs yesterday up to the same time of day
SELECT
  count(*) FILTER (WHERE created_at >= date_trunc('day', now())) AS today,
  count(*) FILTER (WHERE created_at >= date_trunc('day', now()) - interval '1 day'
                     AND created_at <  now() - interval '1 day') AS yesterday_same_time
FROM users
WHERE created_at >= date_trunc('day', now()) - interval '1 day';
Refresh: 15 minutes. Adapt it: group by utm_source to see which channel is moving. Time zones matter: date_trunc('day', now()) uses the session time zone, so set it to your business time zone.
4. Support Queue Dashboard
Scenario: a support lead decides whether to pull someone onto tickets. The metric that matters is the oldest unanswered ticket, not the total count.
Tiles: open tickets, oldest waiting ticket, tickets opened in the last hour, open tickets by priority.
-- Open tickets and the oldest wait, by priority
SELECT priority,
       count(*) AS open_tickets,
       max(now() - created_at) AS oldest_wait
FROM tickets
WHERE status = 'open'
GROUP BY priority
ORDER BY oldest_wait DESC;
Refresh: 5 minutes. Adapt it: set an alert when oldest_wait passes your SLA, for example 4 hours for normal priority.
5. Inventory Below Reorder Point Dashboard
Scenario: an operations manager wants to see which products need reordering before they sell out.
Tiles: items below reorder point, days of stock left per item, stock value.
-- Items below reorder point with days of stock left (based on last 14 days of sales)
SELECT p.sku,
       p.stock_on_hand,
       p.reorder_point,
       round(p.stock_on_hand / NULLIF(s.units_14d / 14.0, 0), 1) AS days_left
FROM products p
LEFT JOIN (
  SELECT product_id, sum(quantity) AS units_14d
  FROM order_items
  WHERE created_at >= now() - interval '14 days'
  GROUP BY product_id
) s ON s.product_id = p.id
WHERE p.stock_on_hand <= p.reorder_point
ORDER BY days_left NULLS LAST;
Refresh: 1 hour. Reorders take days, so minute-level refresh only adds load.
6. MRR by Plan
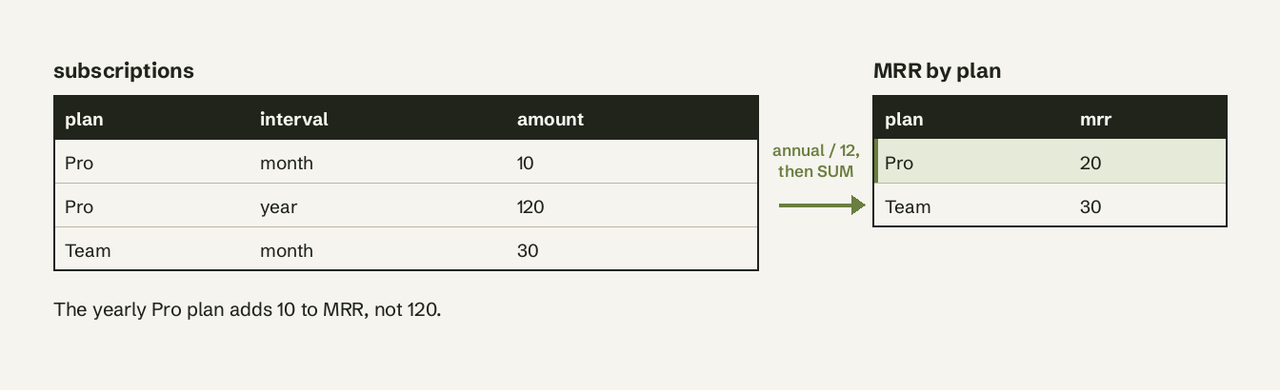
Scenario: a SaaS founder wants MRR, new MRR and churned MRR without waiting for a monthly spreadsheet.
Tiles: current MRR, new MRR this month, churned MRR this month, MRR by plan.
-- Current MRR by plan from active subscriptions
SELECT plan,
       count(*) AS customers,
       sum(CASE WHEN billing_interval = 'year' THEN amount / 12.0 ELSE amount END) AS mrr
FROM subscriptions
WHERE status = 'active'
GROUP BY plan
ORDER BY mrr DESC;
Refresh: daily, or hourly at most. MRR only moves with billing events. For the full set of retention metrics, see SaaS customer retention metrics.
7. Sales Pipeline Dashboard
Scenario: a sales lead runs the Monday pipeline review from the database instead of a CRM export.
Tiles: open pipeline by stage, deals won this month, deals with no activity in 14 days.
-- Open pipeline value by stage, plus stale deals
SELECT stage,
       count(*) AS deals,
       sum(amount) AS pipeline_value,
       count(*) FILTER (WHERE last_activity_at < now() - interval '14 days') AS stale_deals
FROM deals
WHERE status = 'open'
GROUP BY stage
ORDER BY pipeline_value DESC;
Refresh: 1 hour. More examples of company-wide tiles are in our company metrics dashboard guide.
What Metrics Belong on a Real-Time Dashboard?
A real-time dashboard should hold only metrics where a change in minutes leads to an action in minutes: orders, payments, errors, queue length, uptime. Revenue, churn, retention and pipeline belong on dashboards that refresh hourly or daily. Putting MRR on a 1-minute refresh does not make it more accurate; it adds database load and trains people to stare at numbers that cannot move.
Which Example Should You Use?
| If you need to... | Start with | Interval |
|---|---|---|
| Catch a broken checkout | 1. Live orders | 1 min |
| Catch failing jobs | 2. Application errors | 1 min |
| Judge a launch or campaign today | 3. Signups vs yesterday | 15 min |
| Staff a support queue | 4. Support queue | 5 min |
| Prevent stockouts | 5. Inventory | 1 hour |
| Report revenue | 6. MRR | daily |
| Run a pipeline review | 7. Sales pipeline | 1 hour |
How Do I Build One From My Own Database?
- Connect a read-only database user (never the app's write user).
- Write one query per tile, filtered to a time window (
now() - interval '1 hour') so each refresh scans little data. - Index the timestamp column you filter on, for example
CREATE INDEX ON orders (created_at);. - For heavy aggregates, precompute them in a materialized view and refresh it on a schedule. In PostgreSQL,
REFRESH MATERIALIZED VIEW CONCURRENTLYrefreshes without locking out readers, but it needs a unique index on the view (PostgreSQL docs). - Set the refresh interval per dashboard from the table above.
- Add alerts for the metrics that matter when nobody is looking.
In AI for Database, steps 2, 5 and 6 are a question, a schedule and a workflow condition. Our page on dashboards and reports shows the flow.
Frequently Asked Questions
What is a live dashboard?
A live dashboard is a dashboard whose queries re-run automatically on a schedule or on each view, so its metrics stay current without manual refreshes.
How often should a live dashboard refresh?
As often as someone can act on a change: 1 minute for orders and errors, 5-15 minutes for queues and signups, hourly or daily for revenue, churn and pipeline.
Is a live dashboard the same as a real-time dashboard?
Mostly. Strictly, real-time means streaming each event as it happens; most live dashboards poll the database every few seconds or minutes, which is close enough for business metrics.
Does a live dashboard slow down my database?
It can. Every refresh re-runs every tile's query. Filter to recent time windows, index timestamp columns, point dashboards at a read replica, and use slower intervals for heavy queries.
Can I get alerts instead of watching a dashboard?
Yes. In AI for Database, action workflows check a condition on your data and send a Slack message, email or webhook when it is met, so the dashboard is for context and the alert is for action. Try AI for Database free at aifordatabase.com: [connect your database or use the sample data](https://app.aifordatabase.com/signup) and build your first self-refreshing dashboard from a plain-English question.