
Company Metrics Dashboard: 6 Examples With the SQL
TL;DR: A company metrics dashboard is one screen with the 5 to 9 numbers leadership checks every week: revenue, growth, retention, pipeline, support load and delivery. Below are six example dashboards, each with the tiles it holds and the exact PostgreSQL query behind every tile, so the numbers mean the same thing to everyone who reads them.
A company metrics dashboard (also called a business metrics dashboard) answers one question: is the company on track this week, and if not, where is it slipping? The best ones are small. A CEO dashboard usually carries MRR, net new MRR, new customers, logo churn, active users, pipeline and open support tickets, each compared with the previous period. What most example galleries skip is the definition of each number. "Active users" or "churn" computed two different ways is how two teams end up arguing about the same chart, so every example here ships with its SQL.
The queries assume a typical SaaS schema in PostgreSQL: customers, subscriptions (with mrr_cents, started_at, canceled_at), events (product usage), deals (CRM pipeline), tickets and orders. Rename columns to match yours.
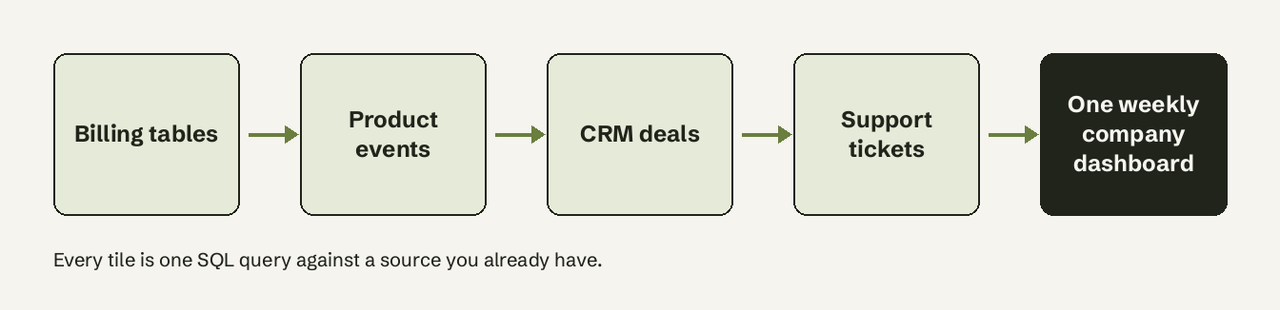
What metrics belong on a company metrics dashboard?
A company dashboard holds metrics that a leader can act on within a week, grouped into four areas:
| Area | Typical tiles | Source table |
|---|---|---|
| Revenue | MRR, net new MRR, ARPA | subscriptions |
| Growth | signups, activation rate, weekly active users | customers, events |
| Retention | logo churn, revenue churn, net revenue retention | subscriptions |
| Sales | pipeline value, win rate, sales cycle | deals |
| Support | open tickets, median first response time | tickets |
| Operations | orders shipped on time, refunds | orders |
If you are new to the vocabulary, our guide to dimensions vs metrics explains why "revenue" is a metric and "country" is a dimension you slice it by.
How many KPIs should a dashboard have?
Keep a company dashboard to roughly 5 to 9 tiles per screen. That is a working rule, not a law: past about nine numbers, readers stop comparing and start scanning, and the tile that moved goes unnoticed. If you need more, split by audience (CEO, sales, support) as the examples below do, rather than adding rows to one page.
1. CEO dashboard
Scenario: the Monday review. One screen, every number compared with last month.
Tiles: MRR, net new MRR, new customers, churned customers, weekly active accounts.
-- MRR at the end of each of the last 6 months
SELECT m.month,
       SUM(s.mrr_cents) / 100.0 AS mrr
FROM generate_series(
       date_trunc('month', now()) - interval '5 months',
       date_trunc('month', now()),
       interval '1 month') AS m(month)
JOIN subscriptions s
  ON s.started_at < m.month + interval '1 month'
 AND (s.canceled_at IS NULL OR s.canceled_at >= m.month + interval '1 month')
GROUP BY m.month
ORDER BY m.month;
What it shows: a month-end MRR series. generate_series builds one row per month even when a month has no new subscriptions, so the line never skips a gap.
How to adapt it: if you bill through Stripe, decide first whether MRR includes discounts. Stripe lets you configure this in Billing (Stripe subscription analytics docs) and notes that subtracting discounts is the more conservative choice; match whatever your finance team reports.
2. Revenue dashboard
Scenario: the founder or finance lead wants to see where MRR moved, not just where it ended.
Tiles: new MRR, expansion, contraction, churned MRR, net new MRR.
-- Net new MRR components for the current month
WITH month AS (SELECT date_trunc('month', now()) AS start)
SELECT
  SUM(mrr_cents) FILTER (WHERE started_at >= (SELECT start FROM month)) / 100.0 AS new_mrr,
  SUM(mrr_cents) FILTER (WHERE canceled_at >= (SELECT start FROM month)) / 100.0 AS churned_mrr,
  (COALESCE(SUM(mrr_cents) FILTER (WHERE started_at >= (SELECT start FROM month)), 0)
   - COALESCE(SUM(mrr_cents) FILTER (WHERE canceled_at >= (SELECT start FROM month)), 0)) / 100.0 AS net_new_mrr
FROM subscriptions;
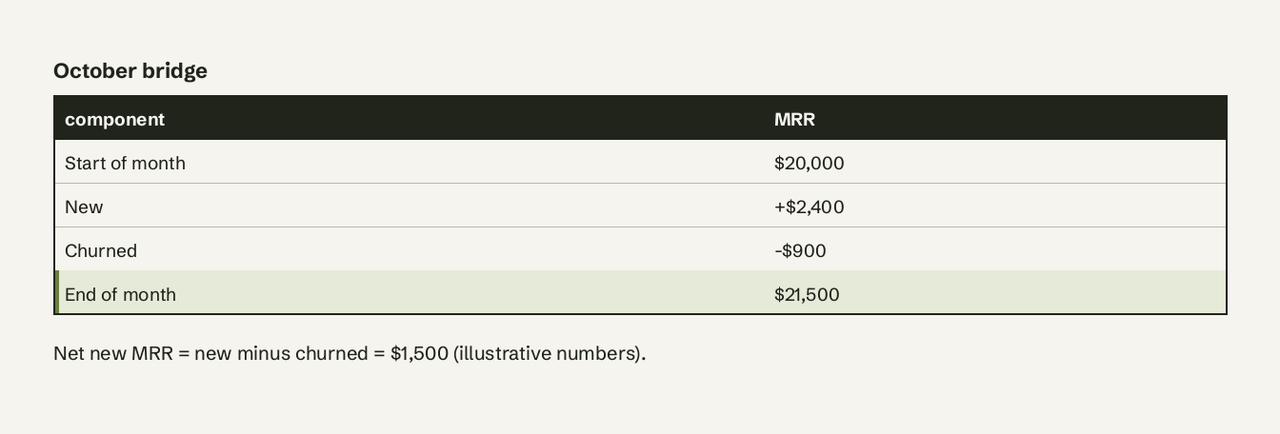
What it shows: the MRR bridge for the month. The FILTER (WHERE ...) clause on an aggregate is standard PostgreSQL (aggregate expressions docs) and replaces a stack of CASE WHEN expressions; see our guide to FILTER in SQL.
How to adapt it: expansion and contraction need a history of plan changes (a subscription_changes table, or Stripe's customer MRR change export, which logs new, upgrade, downgrade, reactivation and churn per customer).
3. Growth dashboard
Scenario: a product-led company tracking whether signups turn into real usage.
Tiles: weekly signups, activation rate, weekly active accounts.
-- Weekly signups and the share that activated within 7 days
SELECT date_trunc('week', c.created_at) AS week,
       COUNT(*) AS signups,
       ROUND(100.0 * COUNT(*) FILTER (
         WHERE EXISTS (
           SELECT 1 FROM events e
           WHERE e.customer_id = c.id
             AND e.name = 'activated'
             AND e.created_at < c.created_at + interval '7 days')
       ) / NULLIF(COUNT(*), 0), 1) AS activation_pct
FROM customers c
WHERE c.created_at >= now() - interval '12 weeks'
GROUP BY 1
ORDER BY 1;
What it shows: activation as a rate per signup cohort, not a raw count, so a big signup week doesn't hide a weak onboarding.
How to adapt it: replace 'activated' with the event that predicts retention in your product (first report built, first teammate invited). If your timestamps are timestamptz, pass a zone to date_trunc (it takes a third time-zone argument, per the PostgreSQL date/time functions docs) so weeks start in your office's time zone; our Postgres timestamptz guide covers the pitfalls.
4. Sales dashboard
Scenario: the weekly pipeline review.
Tiles: open pipeline value, deals won this quarter, win rate, median sales cycle.
-- Win rate and median cycle for deals closed this quarter
SELECT
  COUNT(*) FILTER (WHERE stage = 'won') AS won,
  ROUND(100.0 * COUNT(*) FILTER (WHERE stage = 'won')
        / NULLIF(COUNT(*), 0), 1) AS win_rate_pct,
  percentile_cont(0.5) WITHIN GROUP (
    ORDER BY closed_at - created_at
  ) FILTER (WHERE stage = 'won') AS median_cycle
FROM deals
WHERE stage IN ('won', 'lost')
  AND closed_at >= date_trunc('quarter', now());
What it shows: win rate over closed deals only (open deals would drag it down) and the median, not the mean, sales cycle, because one deal stuck for a year would skew an average.
How to adapt it: percentile_cont accepts an interval in ORDER BY, so the result is an interval like 23 days 04:00:00. Wrap it in EXTRACT(day FROM ...) if your tile wants a plain number.
5. Customer support dashboard
Scenario: the support lead and the CEO both want to know if customers are waiting.
Tiles: open tickets, tickets opened this week, median first response time.
-- Open tickets and median first response this week
SELECT
  COUNT(*) FILTER (WHERE status <> 'closed') AS open_tickets,
  COUNT(*) FILTER (WHERE created_at >= date_trunc('week', now())) AS opened_this_week,
  percentile_cont(0.5) WITHIN GROUP (
    ORDER BY first_response_at - created_at
  ) FILTER (WHERE created_at >= date_trunc('week', now())
              AND first_response_at IS NOT NULL) AS median_first_response
FROM tickets;
What it shows: load and speed on one tile row. Pair it with churn from example 1: a rise in response time that precedes a rise in churn is the pattern worth an alert.
How to adapt it: count business hours only if that is your SLA; otherwise the weekend inflates the median.
6. Operations dashboard
Scenario: an ecommerce or marketplace business where delivery is the product.
Tiles: orders today, on-time shipping rate, refund rate, revenue today vs same day last week.
-- On-time shipping and refund rate for the last 30 days
SELECT
  COUNT(*) AS orders,
  ROUND(100.0 * COUNT(*) FILTER (WHERE shipped_at <= promised_ship_at)
        / NULLIF(COUNT(*) FILTER (WHERE shipped_at IS NOT NULL), 0), 1) AS on_time_pct,
  ROUND(100.0 * COUNT(*) FILTER (WHERE refunded_at IS NOT NULL)
        / NULLIF(COUNT(*), 0), 1) AS refund_pct
FROM orders
WHERE created_at >= now() - interval '30 days';
What it shows: the share of shipped orders that left on time and the refund rate over the same window, so the two can be read together.
How to adapt it: for a running total of revenue by day, use a window function; see cumulative sum in SQL.
Which example should you start with?
| If you are... | Start with | Add next |
|---|---|---|
| A SaaS founder | 1. CEO | 2. Revenue |
| Product-led, pre-revenue | 3. Growth | 1. CEO |
| Sales-led B2B | 4. Sales | 2. Revenue |
| Support-heavy | 5. Support | 1. CEO |
| Ecommerce or marketplace | 6. Operations | 2. Revenue |
Four steps from raw tables to a live dashboard
To build a company metrics dashboard from your database, go from definitions to alerts:
- Write the definitions first. One sentence per tile ("Active account: any account with an
activatedevent in the last 7 days"). The SQL above is those sentences made exact. - Run each query against a read-only connection to your production replica or warehouse, never the primary with a write user.
- Put the queries in a BI tool and schedule a refresh. Metabase, Apache Superset and Grafana are free and open source and all accept raw SQL tiles; Looker Studio is free but works best with Google sources. Our roundup of free reporting tools compares them.
- Add an alert to the one or two tiles that need action, such as churned MRR or open tickets, so nobody has to remember to check.
If nobody on the team writes SQL, that is the step where AI for Database helps: connect PostgreSQL, MySQL, BigQuery or Supabase, ask "MRR by month for the last 6 months" in plain English, check the SQL it shows, pin the answer to a dashboard that refreshes on a schedule and set an alert when a number crosses a threshold. Try AI for Database free at aifordatabase.com (sample data included).
Frequently Asked Questions
What is the difference between a company dashboard and a KPI dashboard?
A KPI dashboard can serve any team or goal; a company dashboard is the KPI dashboard for the whole business, owned by leadership, with one or two tiles per function rather than the full detail of each team.
What should a CEO dashboard include?
MRR or revenue, net new revenue, new customers, churn, active users or accounts, pipeline and one customer-health signal such as open support tickets. Example 1 has the SQL.
How often should a company metrics dashboard refresh?
Daily is enough for most company tiles because leadership reviews them weekly. Refresh more often only for operational tiles, such as orders or open tickets, where someone acts within hours.
Can I build a company dashboard in Google Sheets?
Yes for small data: export or sync tables into Sheets and use formulas. It breaks once tables reach hundreds of thousands of rows or several people edit the formulas, which is when a SQL-backed dashboard pays off.
Why do two dashboards show different numbers for the same metric?
Almost always because the definitions differ: one counts canceled subscriptions at the cancel date, the other at period end; one includes discounts in MRR, the other doesn't. Writing the definition and the SQL next to each tile, as in the examples above, removes the argument.