
BI Cubes Explained: What Is a Data Cube in BI?
TL;DR: A BI cube (OLAP cube) is a dataset that stores numbers such as revenue already summed by several dimensions at once, so a report can slice, dice and drill down instantly. Cubes powered BI from the 1990s on, but columnar warehouses and semantic layers now do the same job without a separate cube build. You still meet them in SQL Server Analysis Services, Excel PivotTables and SQL's GROUP BY CUBE.
A BI cube is a multidimensional data structure that holds measures (numbers you add up, like revenue or units) at every combination of dimensions (the ways you cut them, like month, region and product). Ask "revenue in Europe for Product A in March" and the cube returns a stored cell instead of scanning millions of rows. Business intelligence cubes, also called OLAP cubes (online analytical processing) or data cubes, are what made drag-and-drop pivot reporting fast on 1990s hardware. Today most teams get the same answers from a columnar warehouse such as BigQuery or Snowflake, with metric definitions held in a semantic layer such as the dbt Semantic Layer or Cube Core.
What are measures, dimensions and hierarchies?
A BI cube is a pre-aggregated, multidimensional view of a fact table. Picture a spreadsheet where rows are regions and columns are months; add a third axis for product and you have a cube. Every small box inside it is a cell holding a measure for one region, one month and one product. Real cubes usually have more than three dimensions; "cube" is just the name, the math is the same for five or fifteen.
Three parts make up every cube:
- Measures: numeric facts such as
sum(revenue),count(orders),sum(units). - Dimensions: categories you analyze by, such as Date, Region, Product, Customer segment.
- Hierarchies: levels inside a dimension. Day rolls into Month, Month into Quarter, Quarter into Year; City rolls into Region.
Why do cubes matter for business reporting?
Cubes matter because they turn slow analytical questions into lookups. Say an ecommerce company has 40 million order lines. A finance manager in Excel wants revenue by quarter and region, then by product inside one region, then the same view for last year. Against raw rows each click is a full scan. Against a cube each click reads a few pre-computed cells, so a PivotTable connected to SQL Server Analysis Services responds immediately.
The trade-off is freshness and flexibility. A cube is only as current as its last processing run (the load that recomputes aggregates), and it only answers questions along the dimensions someone designed in advance. That second limit is the one non-technical teams feel most: if "payment method" is not a dimension, nobody can slice by it until the cube is rebuilt.
How does an OLAP cube work?
An OLAP cube works by computing the measure for every combination of dimension members, including an "All" level for each dimension. With 3 dimensions there are 2^3 = 8 grouping combinations: (month, region, product), (month, region), (month, product), (region, product), (month), (region), (product), and the grand total ().
SQL has this built in. PostgreSQL documents that CUBE ( a, b, c ) represents the given list and all of its possible subsets, the power set, and the same GROUP BY CUBE and ROLLUP syntax exists in SQL Server, BigQuery, Snowflake and Oracle (PostgreSQL docs, GROUPING SETS, CUBE and ROLLUP).
-- Every subtotal for region x product in one query
SELECT region,
       product,
       sum(revenue)                  AS revenue,
       GROUPING(region, product)     AS level  -- 0 = detail, 3 = grand total
FROM   sales
WHERE  order_date >= '2026-01-01' AND order_date < '2026-04-01'
GROUP  BY CUBE (region, product)
ORDER  BY level, region, product;
Rows where a dimension is "All" come back with NULL in that column; the GROUPING() function tells you which subtotal a row is, so you can label it "All regions" instead of guessing.
Where the cube is stored is the classic split:
- MOLAP stores aggregates in a multidimensional array. Fastest reads, slow processing, and the "data explosion" problem as dimensions grow (Online analytical processing, Wikipedia). Examples: Microsoft Analysis Services multidimensional mode, Oracle Essbase, IBM Cognos TM1.
- ROLAP keeps data in relational tables and generates SQL per query.
- HOLAP mixes both: aggregates in cube storage, detail rows in the database.
Worked example: a Q1 sales cube
Here is a small cube with real numbers: two regions, two products, Q1 2026, measure = revenue in dollars.
| Region | Product | Revenue |
|---|---|---|
| Europe | Starter plan | 18,000 |
| Europe | Pro plan | 42,000 |
| US | Starter plan | 25,000 |
| US | Pro plan | 65,000 |
Running GROUP BY CUBE (region, product) on those rows returns 9 rows: the 4 detail cells, 2 region subtotals, 2 product subtotals and 1 grand total.
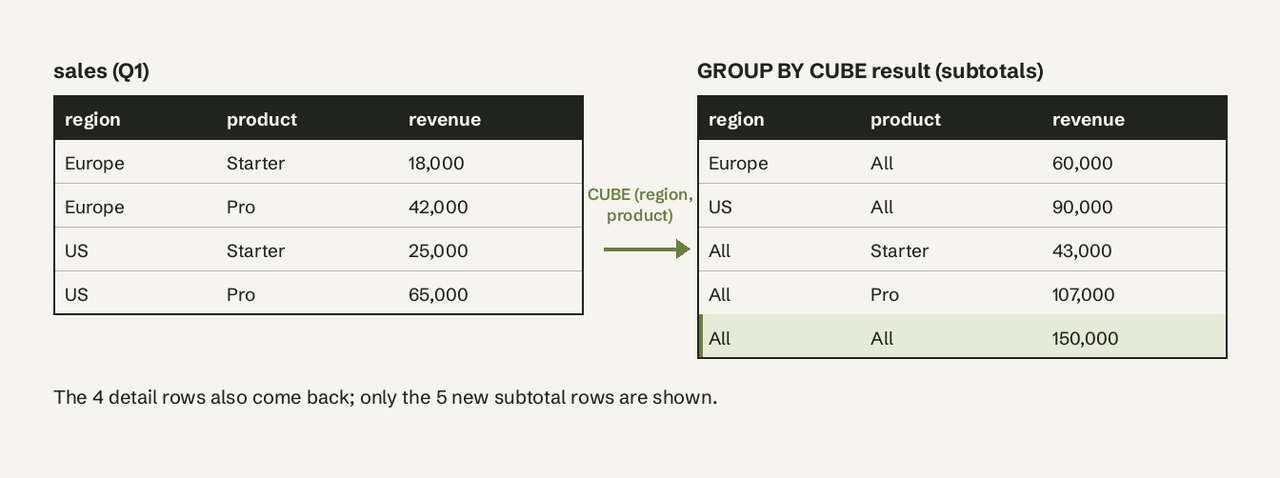
From those cells a reader can answer, without touching raw data:
- US share of revenue: 90,000 / 150,000 = 60%.
- Pro plan share in Europe: 42,000 / 60,000 = 70%, against 65,000 / 90,000 = 72% in the US.
- Starter is 43,000 / 150,000 = 28.7% of the quarter.
Scale that up and you see why cubes get heavy: 12 months x 20 regions x 500 products is 120,000 detail cells, and adding the "All" level on each dimension gives 13 x 21 x 501 = 136,773 cells before a fourth dimension multiplies it again.
What are OLAP operations?
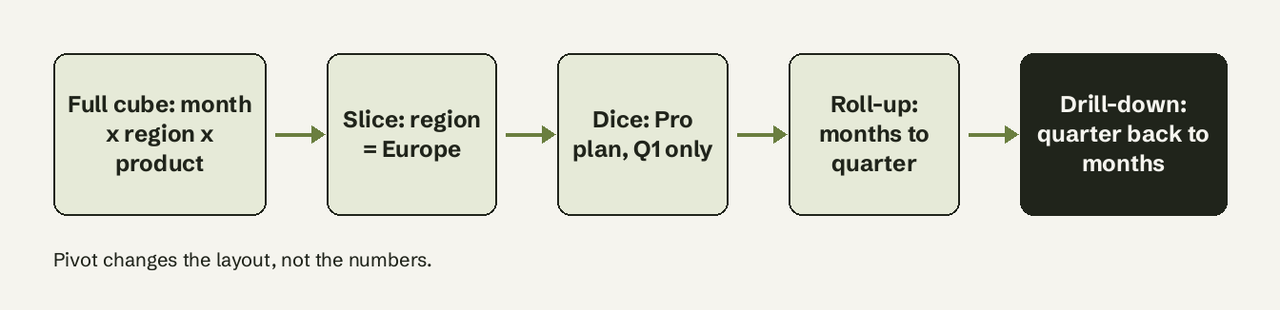
OLAP operations are the five standard ways to move around a cube:
- Slice: fix one dimension to one value, such as Region = Europe, which leaves a smaller cube with one fewer dimension.
- Dice: pick specific values on several dimensions, such as Region in (Europe, US) and Product = Pro.
- Roll-up: summarize up a hierarchy, Month to Quarter to Year.
- Drill-down: the reverse, Year to Quarter to Month, or Region to City.
- Pivot: rotate the axes, products as rows instead of columns.
One technical catch: roll-ups are cheap only for decomposable aggregates. SUM, COUNT, MIN and MAX of a parent can be computed from its children's cells; MEDIAN and distinct counts cannot, because the median of a set is not the median of the medians of its subsets (OLAP cube, Wikipedia). That is why "unique customers by quarter" is often slower or approximate in cube tools.
Are cubes still used?
Yes, but mostly inside tools rather than as a thing you build. Microsoft's Analysis Services engine (VertiPaq) runs the semantic models behind Power BI and Microsoft Fabric, and SQL Server Analysis Services still supports both tabular and multidimensional models on premises, while Azure Analysis Services supports tabular models at compatibility level 1200 and above (Microsoft Learn, Analysis Services overview). Excel PivotTables still connect to cubes over MDX, and MicroStrategy still calls its cached datasets "Intelligent Cubes".
What changed is that new projects rarely build a standalone MOLAP cube. Columnar warehouses scan billions of rows per second for aggregate queries, so pre-computing every combination is no longer worth the processing window and the rigid design. The cube's other job, defining what "revenue" or "active customer" means once, moved to semantic layers.
Cube vs semantic layer: what is the difference?
A cube stores pre-computed numbers; a semantic layer stores definitions and computes numbers on demand from the warehouse. Both give business users consistent metrics; they differ in where the work happens.
| OLAP cube | Semantic layer | |
|---|---|---|
| What it stores | Aggregated cell values | Metric and join definitions (code) |
| Freshness | As of last processing run | Live, or cached by policy |
| New dimension | Redesign and reprocess | Edit the model, redeploy |
| Query language | MDX, DAX | SQL, APIs, MCP |
| Examples | SSAS multidimensional, Essbase | dbt Semantic Layer (MetricFlow), Cube Core, LookML |
The dbt Semantic Layer, powered by MetricFlow, lets data teams define metrics on top of existing dbt models so every downstream tool uses the same definition (dbt docs). Cube describes Cube Core as an open-source semantic layer that centralizes metric definitions, joins, access rules and caching, with pre-aggregations playing the role cubes used to (Cube docs). We compare one vendor's approach in Holistics semantic layer trade-offs.
Cube vs data warehouse vs data mart
A data warehouse stores detailed, cleaned rows from many systems. A data mart is a subject-specific slice of it (finance, sales). A cube sits on top of either and stores aggregates for fast analysis. Many teams confuse "cube" with "warehouse"; the warehouse holds facts, the cube holds answers computed from them.
Pitfalls of BI cubes
- Stale numbers. A nightly-processed cube shows yesterday. Label the processing time on every report.
- Dimension explosion. Each new dimension multiplies cell count; high-cardinality fields like customer ID or email do not belong in a MOLAP cube.
- Non-additive measures. Ratios, medians and distinct counts must be defined carefully or they roll up wrong. Store numerator and denominator and divide at query time.
- Locked-in questions. Anything outside the designed dimensions needs a rebuild, which sends business users back to the data team.
That last pitfall is why many small companies skip cubes entirely. If your data lives in Postgres, MySQL or Supabase and you don't have a data team, AI for Database lets you ask "revenue by region and plan for Q1, with subtotals" in plain English; it writes the GROUP BY against the live database, shows the SQL, and can pin the answer to a self-refreshing dashboard. Try AI for Database free at aifordatabase.com. For the metrics worth putting on that dashboard, see our SaaS metrics glossary, the MRR dashboard guide and database dashboards.
Frequently Asked Questions
What is a data cube in simple terms?
A data cube is a table of numbers that has been pre-added up in every combination of the categories you care about, such as month, region and product, so any summary you ask for is ready instantly.
Is a Power BI dataset a cube?
Effectively, yes. Power BI semantic models (formerly datasets) run on the Analysis Services VertiPaq engine and are queried with DAX, the tabular successor to multidimensional cubes queried with MDX.
What is the difference between OLAP and OLTP?
OLTP (online transaction processing) systems record individual events, such as one order insert, and are tuned for many small writes. OLAP systems, including cubes, are tuned for reading and aggregating large volumes of history.
What does GROUP BY CUBE do in SQL?
GROUP BY CUBE (a, b) returns aggregates for every subset of the listed columns: (a, b), (a), (b) and the grand total. With n columns it produces 2^n grouping sets, which is the SQL version of building a small cube.
What is the difference between a cube and a pivot table?
A pivot table is a view; a cube is a data source. An Excel PivotTable can sit on a worksheet range or connect to an Analysis Services cube, in which case it reads pre-aggregated cells instead of raw rows.
Do I need a cube for a small business?
Usually not. If your database has millions rather than billions of rows, a plain GROUP BY on Postgres or MySQL, or a warehouse such as BigQuery, returns these summaries in seconds without a processing step.