
What Is Dimensional Modeling? Kimball Method Explained
TL;DR: Dimensional modeling is a way to design a data warehouse around business events (facts) and the things that describe them (dimensions), usually arranged as a star schema. Ralph Kimball formalised it in 1996, and its four-step method (process, grain, dimensions, facts) is still how most analytics tables in dbt, Snowflake and BigQuery projects are shaped.
Dimensional modeling is a data modeling technique that organizes warehouse data into fact tables, which record measurable business events such as payments or signups, and dimension tables, which hold the descriptive context such as customer, plan and date. The Kimball method designs one business process at a time: pick the process, declare the grain (what one fact row means), choose the dimensions, then list the numeric facts. The result is a star schema where every question is a join from one fact table to a few dimensions, which is why BI tools and analysts find it easy to query.
What is dimensional modeling, and where did it come from?
Dimensional modeling is the design approach Ralph Kimball introduced to the data warehouse and BI industry in 1996 with The Data Warehouse Toolkit. The Kimball Group's official catalogue of techniques is drawn from the book's third edition and covers everything from fact table types to eight kinds of slowly changing dimensions (Kimball Group techniques).
It is a bottom-up method: you model the business processes that matter first and integrate them through shared dimensions later. Bill Inmon's competing approach is top-down, starting with an enterprise-wide normalized model (Wikipedia). The model is logical, so it does not even require a relational database, though in practice it almost always lives in one.
Why does it matter? A SaaS scenario
Picture a SaaS company whose app database has users, accounts, subscriptions, invoices and plan_changes, all in third normal form. The finance lead asks: "What was MRR by plan and signup cohort last quarter?" Against the app schema that is a five-table query with date logic about which subscription was active when. Every analyst writes it slightly differently, and the numbers disagree.
A dimensional model turns that into one fact table and three dimensions. The question becomes a SUM with a GROUP BY, and everyone gets the same answer because the grain and the joins are fixed once.
How does the four-step design process work?
The Kimball four-step process makes four decisions in order (Kimball Group, four-step process):
- Select the business process. Here: recurring subscription revenue.
- Declare the grain. One row per account per month. This is the decision that matters most; every fact and dimension must be true at this grain.
- Identify the dimensions. Account, plan, month (date).
- Identify the facts. MRR amount, seat count, and flags for new, expansion and churned revenue.
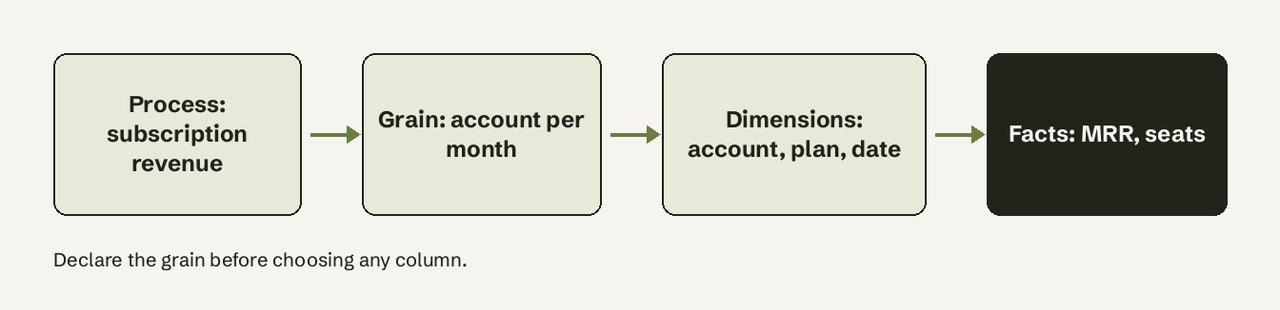
Fact tables vs dimension tables
A fact table records measurements of a business process; a dimension table describes who, what, where and when. dbt Labs' guide puts it simply: facts are verbs (payments, emails sent), dimensions are nouns (customers, products), and fact tables are a historical record you append to rather than overwrite (dbt Labs guide).
| Fact table | Dimension table | |
|---|---|---|
| Holds | Numeric measurements of events | Descriptive attributes |
| Example | fct_mrr_monthly | dim_account, dim_plan, dim_date |
| Row count | Large, keeps growing | Small to medium |
| Keys | Foreign keys to every dimension | One surrogate key |
| Changes | Append new rows | Updated via slowly changing dimension rules |
Kimball names four fact table types: transaction (one row per event), periodic snapshot (one row per period, like our monthly MRR), accumulating snapshot (one row per pipeline, updated as milestones pass) and factless (events with no measure, like a login). A periodic snapshot's grain is the period, not the transaction, and it gets a row even when nothing happened, with zero or null facts (Kimball Group, periodic snapshots). Facts are also additive (MRR sums across everything), semi-additive (seat count sums across accounts but not across months) or non-additive (ratios like ARPA).
For more on the attribute-versus-measure distinction in BI tools, see our guide to dimensions vs metrics.
Worked example: the SaaS star schema in SQL
Here is the model as Postgres DDL. Surrogate keys keep the fact table independent of app IDs.
CREATE TABLE dim_date (
  date_key      int PRIMARY KEY,      -- 20260901
  month_start   date NOT NULL,
  quarter       text NOT NULL,        -- '2026-Q3'
  year          int NOT NULL
);

CREATE TABLE dim_plan (
  plan_key      serial PRIMARY KEY,
  plan_name     text NOT NULL,        -- 'Starter', 'Growth'
  list_price    numeric(10,2) NOT NULL
);

CREATE TABLE dim_account (
  account_key   serial PRIMARY KEY,
  account_id    uuid NOT NULL,        -- natural key from the app
  company_name  text,
  country       text,
  signup_cohort text,                 -- '2026-07'
  valid_from    date NOT NULL,        -- SCD type 2 columns
  valid_to      date,
  is_current    boolean NOT NULL DEFAULT true
);

CREATE TABLE fct_mrr_monthly (
  date_key      int REFERENCES dim_date,
  account_key   int REFERENCES dim_account,
  plan_key      int REFERENCES dim_plan,
  mrr           numeric(10,2) NOT NULL,
  seats         int NOT NULL,
  is_new        boolean NOT NULL,
  is_churned    boolean NOT NULL,
  PRIMARY KEY (date_key, account_key)
);
Take three accounts in September 2026. Acme is on Growth at $490, Bolt on Starter at $90, Cora on Growth at $490 and new this month. Total MRR is $1,070; Growth contributes $980, or 91.6%.
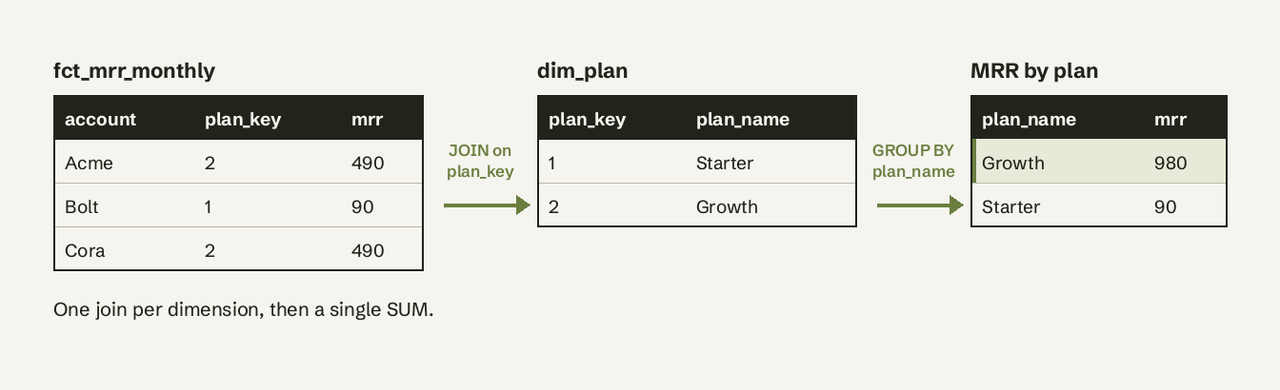
The finance question from earlier is now short:
SELECT p.plan_name, a.signup_cohort, SUM(f.mrr) AS mrr
FROM fct_mrr_monthly f
JOIN dim_plan p    ON p.plan_key = f.plan_key
JOIN dim_account a ON a.account_key = f.account_key
JOIN dim_date d    ON d.date_key = f.date_key
WHERE d.quarter = '2026-Q3'
  AND d.month_start = '2026-09-01'
GROUP BY p.plan_name, a.signup_cohort
ORDER BY mrr DESC;
Because MRR is semi-additive across time, the query filters to the last month of the quarter instead of summing three months. Writing that rule into the model's docs is part of the job. If you want the metric logic itself, our MRR dashboard guide covers new, expansion and churned MRR.
Star vs snowflake schema
A star schema keeps each dimension as one wide, denormalized table, so every dimension is a single join from the fact table. A snowflake schema normalizes dimensions into sub-tables (for example dim_plan pointing to dim_product_line), which saves storage but adds joins. Kimball's techniques treat snowflaked dimensions as allowed but generally discouraged for usability. Microsoft's Power BI guidance also recommends star schemas for semantic models (Microsoft Learn). Columnar warehouses compress repeated values well, so the storage argument for snowflaking is weaker than it was in 1996.
Dimensional modeling vs one big table and Data Vault
| Approach | Shape | Best for | Weak spot |
|---|---|---|---|
| Kimball dimensional | Facts + conformed dimensions | BI, self-serve analytics, shared definitions | Upfront design per process |
| One big table (OBT) | Fully denormalized wide table | A single dashboard, fast scans | Duplicated logic, hard to change dimensions |
| Data Vault 2.0 | Hubs, links, satellites | Auditable raw history from many sources | Not meant for end users; needs a presentation layer |
| Inmon 3NF warehouse | Normalized enterprise model | Central integration | Slow to deliver, complex queries |
Many modern teams combine them: Data Vault or staging tables for raw history, a Kimball layer for the business, and a few wide OBT marts built from that layer for specific dashboards.
Is Kimball still relevant with modern warehouses?
Yes, with adjustments. Cheap storage and columnar engines removed some of the performance reasons, but not the main one: a fixed grain and shared dimensions mean everyone computes revenue the same way. dbt's own dimensional modeling guide was still being updated in May 2026, and semantic layers such as dbt's MetricFlow expect fact and dimension style models underneath. What teams drop is ceremony: fewer surrogate keys on small dimensions, more type 1 overwrites, and snapshot facts rebuilt from source instead of maintained incrementally. See our explainer on semantic layer vs metrics layer for how the two fit together.
Common pitfalls
- Mixed grain. Putting a monthly total and a per-invoice amount in the same fact table double counts. One grain per fact table.
- Summing semi-additive facts across time. Seat counts and balances need the period-end value, not a sum.
- Overwriting history you need. If a customer's country or plan tier changes and reports must reflect the old value, use slowly changing dimension type 2 (new row with
valid_from/valid_to), not type 1. - Non-conformed dimensions. Two different
dim_customertables in sales and support mean the numbers never line up. Kimball's bus matrix exists to stop this. - Modeling before asking. Start from the questions the business asks, not from the source tables.
Who queries the model once it exists?
A clean star schema is easy for SQL users, but most of the people asking "MRR by plan last quarter" do not write SQL. AI for Database connects to Postgres, BigQuery, Snowflake and other warehouses, lets teammates ask those questions in plain English, shows the SQL it ran against your fact and dimension tables, and keeps the answers on refreshing dashboards. Try AI for Database free at aifordatabase.com. For the vocabulary underneath, our glossary has entries on data warehouses and OLAP.
Frequently Asked Questions
What is dimensional modeling in simple terms?
It is organizing data into tables of events you measure (facts) and tables that describe those events (dimensions), so anyone can slice the measures by the descriptions with simple joins.
What is the difference between a fact table and a dimension table?
A fact table stores numeric measurements at a declared grain, such as MRR per account per month, plus foreign keys. A dimension table stores descriptive attributes, such as plan name or country, with one key that fact rows reference.
What is the difference between a star and a snowflake schema?
In a star schema each dimension is one denormalized table, one join from the fact. In a snowflake schema dimensions are split into normalized sub-tables, which adds joins. Star is the usual default for BI.
What are the four steps of the Kimball method?
Select the business process, declare the grain, identify the dimensions, and identify the facts, in that order.
Is Kimball dimensional modeling still relevant?
Yes. Modern warehouses removed some performance reasons for it, but the shared grain and conformed dimensions that keep metrics consistent are why dbt projects and semantic layers still use it.
Is dimensional modeling the same as Data Vault?
No. Data Vault (hubs, links, satellites) is built for auditable raw history from many sources. It is usually paired with a dimensional layer that business users actually query.