
Dashboard Types: 7 Examples With Tiles, Refresh and SQL
TL;DR: There are four main dashboard types: operational (what needs attention right now), analytical (why a number changed), strategic (are we on track for the year) and tactical (is this team or project on plan). They differ in audience, refresh cadence and depth, not in chart style. With AI for Database you can build each type from plain-English questions on your own database, and the dashboards refresh themselves on a schedule.
Try AI for Database free at aifordatabase.com: start with sample data.
The four types of dashboards are operational, analytical, strategic and tactical. An operational dashboard monitors current activity in near real time (orders, errors, support queue). An analytical dashboard lets someone investigate trends and causes in historical data (cohorts, funnels). A strategic dashboard tracks a few long-term outcomes for leadership (MRR, retention, margin) and updates daily to monthly. A tactical dashboard tracks a team plan over weeks (pipeline vs quota, campaign pacing). ThoughtSpot uses the same four labels and notes they are "a useful starting point, not a universal industry standard" (ThoughtSpot); Wayne Eckerson's book Performance Dashboards uses three (operational, tactical, strategic) (O'Reilly). The seven dashboard examples below show each type with its tiles, its refresh cadence and the Postgres query behind one tile.
What Are the Main Types of Dashboards?
A dashboard is a screen of selected metrics used to monitor, analyze and display data on a defined topic (the UK Office for National Statistics definition quoted by ThoughtSpot). Klipfolio draws the line with reports: reports are static snapshots, dashboards update with live data (Klipfolio). The four types split by the decision they support:
| Type | Question it answers | Audience | Typical refresh | Depth |
|---|---|---|---|---|
| Operational | What needs attention right now? | Ops, support, on-call | 1 to 15 minutes | Shallow, alert-like |
| Analytical | What changed, and why? | Analysts, PMs, founders | Daily, or on demand | Deep, filterable |
| Strategic | Are we on track long term? | Founders, execs, board | Daily to monthly | Few KPIs, trends |
| Tactical | Is this team or project on plan? | Team leads | Hourly to weekly | Targets vs actuals |
The same metric can sit on several types. Revenue is a strategic annual outcome, a tactical weekly target for sales, and an analytical question when it drops.
How AI for Database Builds Each Dashboard Type
AI for Database connects read-only to PostgreSQL, MySQL, SQL Server, Supabase, BigQuery, MongoDB and other sources. You ask a question such as "Show me signups per day for the last 30 days", it writes and runs the SQL, shows the answer with its SQL, and you pin it to a dashboard. Dashboards are self-refreshing on a schedule. For the four types that means:
- Operational: short refresh plus action workflows. A condition like "when daily signups drop below 50" sends a Slack alert, email or webhook, so nobody has to stare at the screen.
- Analytical: follow-up questions in plain English ("break that down by plan") instead of pre-built filters.
- Strategic and tactical: a handful of pinned KPI tiles that refresh daily or hourly.
Pricing: start free with sample data, then 100 free queries on your own database; Pro is $10 per user per month and Team $30 (pricing, read 2026-10-23). What it does not do: pixel-perfect paginated print reports. For those, SSRS or Power BI paginated reports fit better.
What Is the Difference Between Operational and Analytical Dashboards?
Use an operational dashboard when someone must act within minutes; use an analytical dashboard when someone must understand a change. Operational dashboards show a few current numbers with thresholds and refresh every few minutes. Analytical dashboards show historical data with filters and breakdowns and are opened when a question comes up. An operational dashboard tells support the queue is at 140 tickets; an analytical dashboard tells the PM that tickets doubled after the 3.2 release and come mostly from one feature.
Which Dashboard Types Are Shown Below?
| # | Example | Type | Refresh |
|---|---|---|---|
| 1 | Live orders monitor | Operational | 1 minute |
| 2 | Support queue | Operational | 5 minutes |
| 3 | Signup cohort retention | Analytical | Daily |
| 4 | Funnel drop-off | Analytical | Daily |
| 5 | Founder KPI board | Strategic | Daily |
| 6 | Sales pipeline vs quota | Tactical | Hourly |
| 7 | Campaign pacing | Tactical | Daily |
1. Live Orders Monitor (Operational)
Scenario: an ecommerce team checks checkout health during a sale.
Tiles: orders per minute (last hour), failed payments last 15 minutes, revenue today, orders by payment method.
Refresh: every minute. Metabase offers 1, 5, 10, 15, 30 and 60 minute auto-refresh (Metabase docs); Grafana has no auto-refresh until you choose an interval (Grafana docs).
-- orders per minute, last 60 minutes
SELECT date_trunc('minute', created_at) AS minute,
       count(*) AS orders
FROM orders
WHERE created_at >= now() - interval '60 minutes'
GROUP BY 1
ORDER BY 1;
Adapt it: add an alert for "zero orders in the last 10 minutes". That is the tile that matters at 3 a.m.
2. Support Queue (Operational)
Scenario: a support lead decides whether to pull more people onto the queue.
Tiles: open tickets, oldest unanswered ticket age, tickets opened per hour today, open tickets by priority.
Refresh: every 5 minutes.
-- open tickets and the oldest wait in hours
SELECT count(*) AS open_tickets,
       round(extract(epoch FROM now() - min(created_at)) / 3600, 1) AS oldest_wait_hours
FROM tickets
WHERE status = 'open';
Adapt it: split by priority and alert when an urgent ticket waits longer than your SLA.
3. Signup Cohort Retention (Analytical)
Scenario: a SaaS founder wants to know whether newer signups stick better than older ones.
Tiles: weekly cohort table, week-4 retention by signup source, active users by plan.
Refresh: daily; it is read when someone investigates, not watched.
-- share of each weekly signup cohort active 4 weeks later
SELECT date_trunc('week', u.created_at) AS cohort_week,
       count(DISTINCT u.id) AS signups,
       count(DISTINCT e.user_id) AS active_week_4,
       round(100.0 * count(DISTINCT e.user_id) / count(DISTINCT u.id), 1) AS pct
FROM users u
LEFT JOIN events e
  ON e.user_id = u.id
 AND e.created_at >= u.created_at + interval '28 days'
 AND e.created_at <  u.created_at + interval '35 days'
GROUP BY 1
ORDER BY 1;
date_trunc('week', ...) starts weeks on Monday in Postgres (PostgreSQL docs).
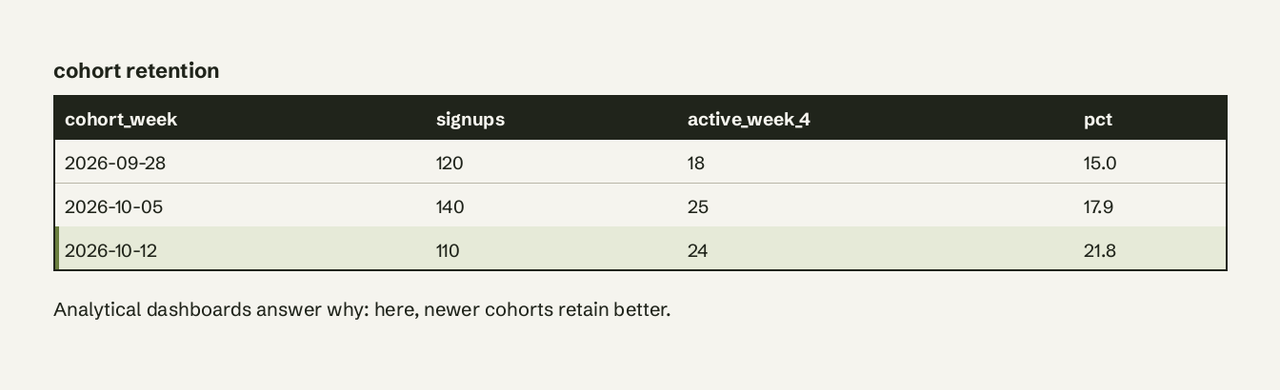
Adapt it: in AI for Database ask "Break week-4 retention down by signup source" instead of building a new filter.
4. Funnel Drop-Off (Analytical)
Scenario: a PM sees fewer paid conversions and needs the step where users leave.
Tiles: signup to activation to paid funnel, conversion by step this month vs last, drop-off by device.
Refresh: daily.
-- three-step funnel for users who signed up in the last 30 days
SELECT count(*) AS signed_up,
       count(*) FILTER (WHERE activated_at IS NOT NULL) AS activated,
       count(*) FILTER (WHERE paid_at IS NOT NULL) AS paid
FROM users
WHERE created_at >= now() - interval '30 days';
Adapt it: add GROUP BY signup_source to see which channel brings users who convert.
5. Founder KPI Board (Strategic)
Scenario: a founder reviews the business every Monday and before board meetings.
Tiles: MRR, net new MRR this month, logo churn rate, customers, gross margin (if tracked in the database).
Refresh: daily. Strategic numbers change with billing events, not by the minute. Power BI import models are limited to 8 scheduled refreshes a day on shared capacity (Microsoft Learn), which is plenty for this type.
-- MRR by month from active subscriptions
SELECT date_trunc('month', s.started_at) AS month,
       sum(s.monthly_amount) AS new_mrr
FROM subscriptions s
WHERE s.status = 'active'
GROUP BY 1
ORDER BY 1;
Adapt it: keep it to five to seven tiles. More detail belongs on an analytical dashboard. See our MRR dashboard guide and executive dashboard from your database.
6. Sales Pipeline vs Quota (Tactical)
Scenario: a sales lead checks whether the quarter is on plan and which reps need help.
Tiles: pipeline by stage, closed-won vs quota by rep, deals stuck in a stage over 30 days.
Refresh: hourly; reps update deals a few times a day.
-- closed-won this quarter vs quota, per rep
SELECT r.name,
       coalesce(sum(d.amount) FILTER (WHERE d.stage = 'closed_won'), 0) AS won,
       r.quarterly_quota,
       round(100.0 * coalesce(sum(d.amount) FILTER (WHERE d.stage = 'closed_won'), 0) / r.quarterly_quota, 1) AS pct_of_quota
FROM reps r
LEFT JOIN deals d
  ON d.rep_id = r.id
 AND d.closed_at >= date_trunc('quarter', now())
GROUP BY r.name, r.quarterly_quota
ORDER BY pct_of_quota DESC;
Adapt it: more in our sales pipeline dashboard guide.
7. Campaign Pacing (Tactical)
Scenario: a marketer checks whether a month-long campaign is on track to hit its signup target.
Tiles: signups to date vs target, expected-by-today line, signups by channel.
Refresh: daily. Looker Studio refreshes Google Analytics and Search Console data every 12 hours, a rate you can't change (Looker Studio Help), so daily pacing fits it too.
-- signups this month vs a straight-line target of 3,000
SELECT count(*) AS signups_to_date,
       round(3000.0 * extract(day FROM now()) / extract(day FROM (date_trunc('month', now()) + interval '1 month - 1 day'))) AS expected_by_today
FROM users
WHERE created_at >= date_trunc('month', now());
Adapt it: see more in our pacing dashboard examples.
How Often Should Each Dashboard Type Refresh?
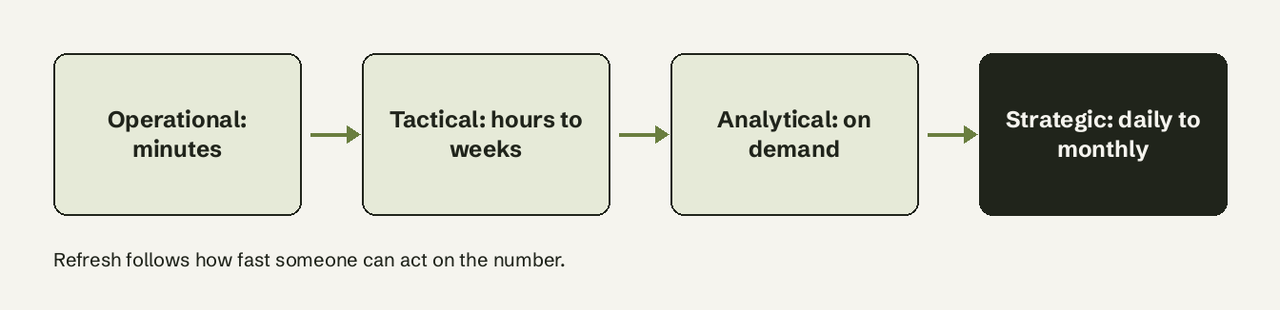
Refresh as often as someone can act on the change, and no faster. Operational: 1 to 15 minutes. Tactical: hourly to daily. Analytical: daily, or on demand. Strategic: daily to monthly. Every refresh re-runs every query on the dashboard, so a 10-tile dashboard on a 1-minute interval sends 600 queries an hour to your database. Keep fast and slow metrics on separate dashboards. Our live dashboard examples list intervals per metric.
Which Dashboard Type Does a Startup Need First?
Most startups need a strategic KPI board first, then one operational dashboard with alerts. A founder needs five numbers every week (MRR, signups, activation, churn, cash), and the one thing that breaks money in real time (checkout, signups) needs an alert. Analytical dashboards come when someone asks "why" more than once a week; tactical ones when you have a team with a quota or a campaign target. With AI for Database, you can start with the analytical questions anyway: ask them in plain English and pin the answers that you want to see again.
Frequently Asked Questions
What are the 4 types of dashboards?
Operational, analytical, strategic and tactical. Operational dashboards monitor current activity, analytical ones investigate trends, strategic ones track long-term outcomes for leadership, and tactical ones track a team or project against its plan.
What is the difference between operational and analytical dashboards?
Operational dashboards show current numbers that need action within minutes and refresh every few minutes. Analytical dashboards show historical data with breakdowns to explain why something changed, and refresh daily or on demand.
How often should each type of dashboard refresh?
Operational every 1 to 15 minutes, tactical hourly to daily, analytical daily or on demand, strategic daily to monthly.
Which dashboard type does a startup need first?
A strategic KPI board with five to seven numbers, plus alerts on the one or two operational metrics that lose money when they break.
Is a dashboard the same as a report?
No. A report is a static snapshot of a known question at a point in time; a dashboard updates with live data and is meant to be monitored.
Can one dashboard be both operational and strategic?
It can, but it usually serves neither well: the refresh rate and level of detail pull in opposite directions. Split them. Try AI for Database free at aifordatabase.com: [connect your database or start with sample data](https://app.aifordatabase.com/signup) and build your first self-refreshing dashboard from plain-English questions.