
SaaS Benchmarks Report Guide: 10 Reports Compared
TL;DR: The most useful SaaS benchmarks reports right now are Benchmarkit's 2026 SaaS and AI Metrics Benchmarks (342 companies), SaaS Capital's 2026 growth benchmarks (1,000+ private companies), the High Alpha + Visible 2026 Startup Benchmarks Report (500+ respondents) and the KeyBanc + Sapphire SaaS Survey. Pick the one whose sample matches your ARR band and funding type, then compute your own numbers the same way the report does. AI for Database turns your billing and product database into those numbers in plain English, so the comparison is like for like.
Try AI for Database free at aifordatabase.com. Sign up at app.aifordatabase.com/signup, sample data included.
A SaaS benchmarks report is a survey or data study that publishes median and quartile values for metrics like ARR growth, net revenue retention (NRR), gross revenue retention (GRR), CAC payback and Rule of 40, cut by company size. The free ones worth using in 2026 are SaaS Capital, Benchmarkit (via Pavilion and Aleph), High Alpha, KeyBanc + Sapphire, ICONIQ, ChartMogul and Baremetrics. Under $1M ARR, use High Alpha (it splits by ARR band and by founding year) and ChartMogul (it uses real billing data from 2,500+ businesses) rather than reports dominated by $20M+ companies.
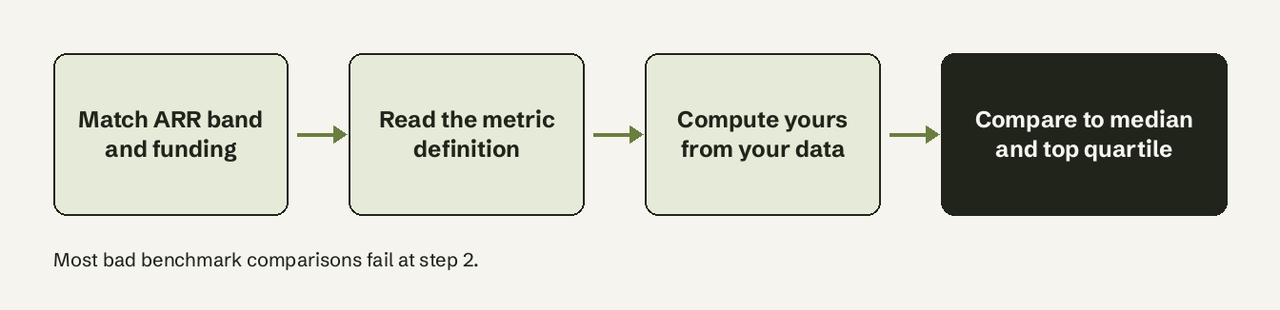
Which SaaS benchmark report fits your stage?
Use the sample, not the headline. A median from a report where most respondents are above $5M ARR says little about a $400K ARR company. This table puts the reports side by side, with what each one is best at.
| Report | Sample | Who it fits | Cost | Key metrics |
|---|---|---|---|---|
| Benchmarkit 2026 SaaS and AI Metrics | 342 B2B SaaS and AI-native companies, 5-year trend | $5M-$100M+ ARR | Free (form) | Growth, NRR, GRR, CAC payback, Rule of 40, ARR per employee |
| SaaS Capital 2026 Growth Benchmarks | 1,000+ private B2B SaaS companies, 15th year | Bootstrapped and equity-backed, all sizes | Free (form) | Growth by ARR, NRR, ACV, funding |
| High Alpha + Visible 2026 Startup Benchmarks | 500+ respondents, 75% US | Seed to $50M ARR, split by AI-era vs Pre-AI | Free (form) | Growth, NRR, pricing model, ARR per employee |
| KeyBanc + Sapphire 2025 SaaS Survey | Private SaaS, 16th year | Growth stage | Free (form) | ARR growth, EBITDA margin, GRR, NRR |
| ICONIQ 2026 State of GTM | 150+ B2B GTM leaders | Growth stage, GTM leaders | Free | Funnel conversion, pricing models, self-serve share |
| Pavilion B2B SaaS Benchmarks | Benchmarkit data, members view | RevOps and CROs | Free report, interactive view for members | CAC ratio, NRR, expansion ARR, burn multiple |
| ChartMogul reports | Billing data from 2,500+ SaaS businesses | Early stage, self-serve | Free | Growth by ARR band, churn, GTM |
| Baremetrics Open Benchmarks | Baremetrics customers | Early-stage Stripe businesses | Free | MRR, churn, LTV, ARPU |
| Bessemer State of the Cloud / State of AI | Bessemer portfolio and Cloud 100 | Venture-backed, AI | Free | Growth, efficiency, AI benchmarks |
| Maxio 2025 B2B SaaS Benchmarks | Maxio report | B2B subscription companies | Free (form) | Growth, retention |
How AI for Database helps you benchmark against these reports
Benchmarks are only useful once your own numbers are computed the same way. That is the part most founders skip, because their MRR lives in Stripe tables, their customers in Postgres, and nobody has time to write the SQL. AI for Database does that job:
- Ask in plain English. Connect PostgreSQL, MySQL, Supabase, BigQuery or another source and ask "What was our gross revenue retention over the last 12 months?" The answer comes back as a table or chart, with its SQL shown so you can check the definition matches the report.
- Pin it to a dashboard. Save NRR, GRR, growth and CAC payback as a self-refreshing dashboard, so next year's report lands next to current numbers instead of a stale spreadsheet.
- Alert on drift. Set an action workflow such as "when monthly GRR drops below 85%, send a Slack alert", the threshold taken from the benchmark you chose.
What it does not do: it does not ship benchmark datasets of its own. You bring the report; it computes your side of the comparison. Pricing is listed at aifordatabase.com/pricing: start free with sample data, Pro is $10 per user per month.
For the metric definitions themselves, see our guides to [net revenue retention](/glossary/net-revenue-retention/), [customer retention metrics for SaaS](/blog/customer-retention-metrics-saas-2026/) and the [SaaS burn multiple](/blog/saas-burn-multiple-formula-benchmarks-2026/).
Survey reports from investors and lenders
These are the reports most often quoted in board decks. All are free behind a form.
- Benchmarkit 2026 SaaS and AI Metrics Benchmarks (summary by Aleph): 342 companies and five years of trend data. Worth it for the seat-based vs usage-based split: median NRR 108% for usage-based vs 98% for seat-based.
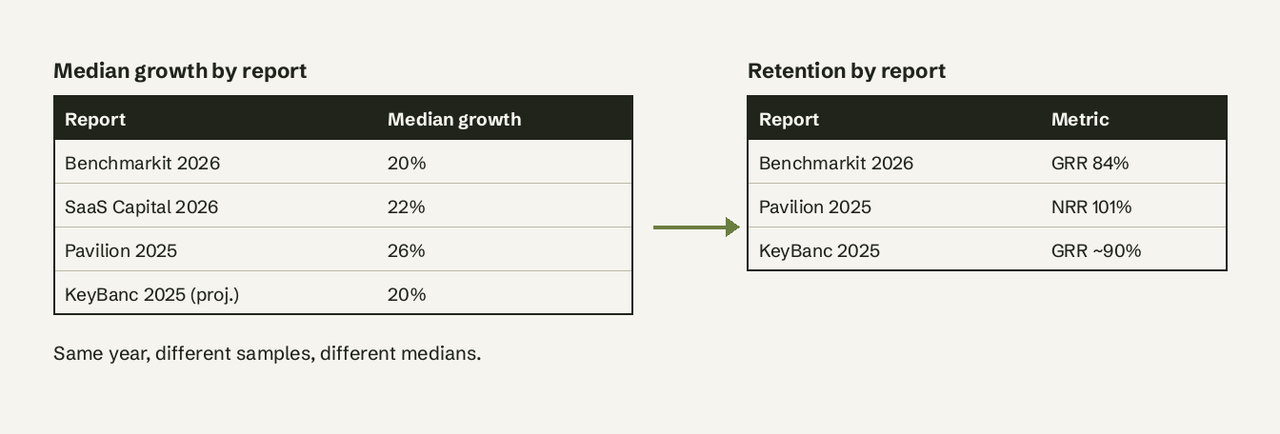
- SaaS Capital 2026 Private SaaS Growth Rate Benchmarks: the largest private sample (1,000+ companies, 15th annual survey). Worth it if you are bootstrapped: it reports bootstrapped median growth (20%) separately from equity-backed (25%).
- High Alpha + Visible 2026 Startup Benchmarks Report: tenth edition, renamed from the SaaS Benchmarks Report this year. Worth it for early stage because it splits companies founded in 2022 or later from older ones.
- KeyBanc Capital Markets + Sapphire Ventures SaaS Survey: the longest-running private SaaS survey (16th year). Worth it for EBITDA margin trends at growth stage.
- ICONIQ 2026 State of Go-to-Market: 150+ GTM leaders. Worth it for pricing model and self-serve revenue share, not for retention medians.
- Bessemer State of AI: worth it if you are an AI-native company comparing growth curves against AI peers.
Benchmarks from billing data
Billing-platform benchmarks come from real revenue records instead of survey answers, which removes self-reporting bias but skews toward companies that use that billing tool.
- ChartMogul reports: aggregated, anonymised data from 2,500+ SaaS businesses. Worth it under $1M ARR, where surveys have few respondents.
- Baremetrics Open Benchmarks: free, live benchmarks for MRR, churn and ARPU. Worth it for self-serve Stripe businesses checking churn monthly.
- Maxio 2025 B2B SaaS Benchmarks Report: from a B2B subscription billing vendor. Worth it as a second opinion next to a survey-based report.
Community and operator views
- Pavilion B2B SaaS Performance Benchmarks: median growth 26%, NRR 101% and expansion at 40% of new ARR in the 2025 edition. Worth it for RevOps leaders who need CAC ratio and burn multiple by ACV band.
- Kyle Poyar's Growth Unhinged: an operator's reading of benchmark reports with pricing and PLG context. Worth it for product-led companies.
What metrics do SaaS benchmark reports cover?
Almost every report covers the same core set: ARR growth rate, NRR, GRR, CAC payback, Rule of 40, gross margin and ARR per employee. The differences are in definitions. Benchmarkit measures GRR as revenue kept from existing customers before expansion; some reports use logo churn instead. Before comparing, read the methodology page and match:
- The time window (trailing 12 months or calendar year).
- Whether NRR includes or excludes new customers added during the period.
- Whether growth is ARR growth or revenue growth.
- The ARR band and funding type of the sample.
If you compute NRR on a monthly basis and the report uses annual cohorts, the numbers will not line up. Our [SaaS unit economics guide](/blog/saas-unit-economics-7-metrics-2026/) lists the formulas.
How should you compare your metrics to a benchmark?
Compare to the median and the top quartile of your band, not to the headline number. A $2M ARR bootstrapped company growing 20% is at the SaaS Capital bootstrapped median; the same 20% looks weak against High Alpha's AI-era cohort. Use one report as your primary source for a full year so the trend is comparable, and note its sample in your board deck.
-- Gross revenue retention, trailing 12 months, from a subscriptions table
SELECT
  SUM(LEAST(curr.mrr, prev.mrr)) / SUM(prev.mrr) AS grr
FROM subscriptions prev
LEFT JOIN subscriptions curr
  ON curr.customer_id = prev.customer_id
 AND curr.month = date_trunc('month', now())
WHERE prev.month = date_trunc('month', now()) - interval '12 months';
Start here: a path for a first-time founder
- Read the SaaS Capital growth brief to see where your growth rate sits for your funding type.
- Read the Aleph summary of Benchmarkit for retention and efficiency context.
- If you are under $1M ARR, check ChartMogul for your ARR band.
- Compute your own GRR, NRR and growth from your database, using the same definitions.
- Save them to a dashboard and set an alert at the median threshold.
Get your side of the benchmark
The report gives you the market's numbers; your database has yours. Ask for GRR, NRR and growth in plain English, see the SQL, and pin them to a dashboard that refreshes itself. See how it works for [SaaS teams](/use-cases/saas/).
Try AI for Database free at aifordatabase.com. Sign up at app.aifordatabase.com/signup, sample data included.
Frequently Asked Questions
Which SaaS benchmark reports are free?
All the reports listed here are free to read. SaaS Capital, Benchmarkit, High Alpha, KeyBanc + Sapphire and Maxio ask for a form with your email; ChartMogul, Baremetrics Open Benchmarks, ICONIQ and Bessemer publish openly. Pavilion's interactive view is for members.
Which benchmark report fits an early-stage company under $1M ARR?
High Alpha (it reports growth below $1M ARR and splits AI-era from Pre-AI companies) and ChartMogul (billing data from 2,500+ businesses, many small). Benchmarkit and KeyBanc skew to larger companies.
What metrics do SaaS benchmark reports cover?
ARR growth, net revenue retention, gross revenue retention, CAC payback, Rule of 40, gross margin, burn multiple and ARR per employee. GTM reports like ICONIQ add funnel conversion and pricing model mix.
How should you compare your metrics to a benchmark?
Pick one report that matches your ARR band and funding type, compute your metric with the same definition and time window, and compare against the median and top quartile, not the overall headline.
What is a good NRR for SaaS in 2026?
Above 100% means expansion outruns churn. Benchmarkit 2026 reports 108% median for usage-based pricing and 98% for seat-based; High Alpha reports 112% for companies whose revenue rises with usage.
- 9 BEST FREE REPORTING TOOLS FOR SQL DATA (COMPARED) →
- BEST TEXT-TO-SQL TOOLS IN 2026: 10 OPTIONS COMPARED →
- 9 BEST EMBEDDED BI TOOLS FOR SAAS TEAMS (COMPARED) →
- WHAT IS A PARAMETERIZED REPORT? DEFINITION AND EXAMPLES →
- AVERAGE SAAS PROFIT MARGIN: 2026 BENCHMARKS →
- SQL SNIPPETS: WHERE TO SAVE THEM AND LIBRARIES TO USE →