
7 Best Free Database Monitoring Tools (Compared)
TL;DR: Free database monitoring tools watch one of three things: the server (CPU, disk, connections), query performance (slow and heavy queries), or the business data inside the tables. Use Percona Monitoring and Management, pgwatch, Prometheus exporters with Grafana, Zabbix or Netdata for the first two. Use AI for Database when you need an alert because the data itself changed, like signups dropping or a large order landing.
Try AI for Database free at aifordatabase.com (sign up, sample data included).
The best free database monitoring tools in 2026 are Percona Monitoring and Management (PMM) for MySQL, PostgreSQL and MongoDB in one place; pgwatch for PostgreSQL only; Prometheus with postgres_exporter or mysqld_exporter and Grafana if you already run Prometheus; Zabbix for teams that monitor servers and networks too; Netdata for per-second host metrics with almost no setup; and the Grafana Cloud free tier if you don't want to host anything. None of these tell you that revenue fell or a customer stopped ordering, because they read database internals, not your rows. AI for Database covers that third layer: you describe a condition in plain English and it alerts you on Slack, email or a webhook.
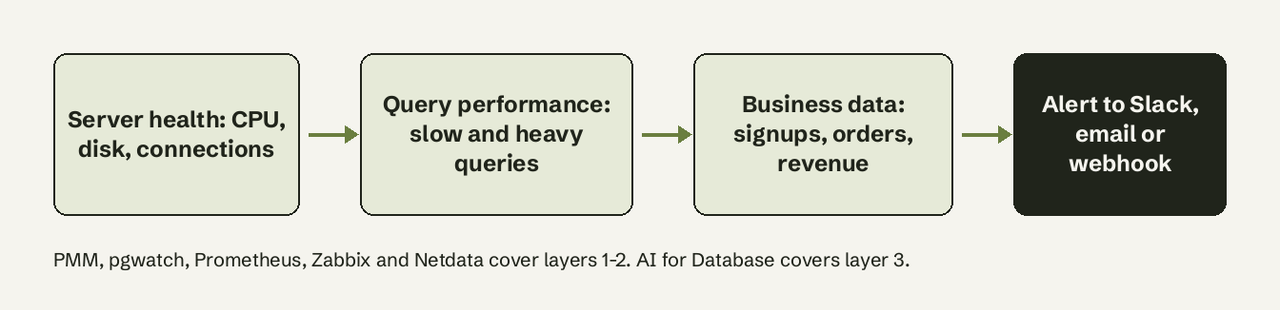
What is the difference between infrastructure and query monitoring?
Infrastructure monitoring is watching the machine the database runs on: CPU, memory, disk I/O, free space, replication lag and open connections. Query monitoring is watching what the database does with its work: which statements run most often, which take longest and which hold locks. In PostgreSQL the query layer usually comes from the pg_stat_statements extension, which tracks planning and execution statistics for every SQL statement (PostgreSQL 18 docs).
-- PostgreSQL: the 5 queries using the most total time
CREATE EXTENSION IF NOT EXISTS pg_stat_statements;

SELECT calls,
       round(total_exec_time::numeric, 0) AS total_ms,
       round(mean_exec_time::numeric, 1)  AS mean_ms,
       left(query, 60)                    AS query
FROM pg_stat_statements
ORDER BY total_exec_time DESC
LIMIT 5;
There is a third layer most lists skip: data monitoring. That is watching the values in your tables (daily signups, failed payments, inventory below a threshold). A database can be perfectly healthy while the business number inside it is falling. You need different tools for that, and it is the layer AI for Database is built for.
How we judged
We read each tool's own site and docs on 2026-11-17 and judged on four criteria:
- What it watches: server health, query performance, or business data.
- Databases supported: PostgreSQL, MySQL, MongoDB, SQL Server and others.
- Setup effort: hosted, one agent, or a stack you run yourself.
- What is free: open source, a free tier, or a free start, and where the free part stops.
Summary table
| Tool | Watches | Databases | Setup | Free option | Paid from |
|---|---|---|---|---|---|
| AI for Database | Business data, with alerts | PostgreSQL, MySQL, SQL Server, MongoDB, Supabase, BigQuery and more | Hosted, connect in minutes | Free start with sample data | $20/user/month |
| Percona PMM | Server + queries | MySQL, PostgreSQL, MongoDB | Self-hosted server + agents | Open source | Percona support |
| pgwatch | Server + queries | PostgreSQL only | Self-hosted, Grafana | Open source | Cybertec support |
| Prometheus + exporters + Grafana | Server + custom metrics | PostgreSQL 13-18, MySQL 5.6+, many more | Self-hosted stack | Open source | None |
| Zabbix | Servers, networks, databases | PostgreSQL, MySQL, many more via templates | Self-hosted server + agents | Open source (AGPLv3) | Zabbix support |
| Netdata | Host + database metrics | 800+ integrations | One agent | Community plan | $7/node (Business) |
| Grafana Cloud Free | Server + custom metrics | Anything you can scrape | Hosted | 10k series, 14-day retention | $19/month + usage |
1. AI for Database
What it is: An AI data platform for teams without a data team. You connect PostgreSQL, MySQL, SQL Server, Oracle, SQLite, MongoDB, Supabase, BigQuery or another source, ask questions in plain English, pin answers to dashboards that refresh on a schedule, and set up action workflows that watch the data.
What it monitors: the business numbers, not the server. Anything you can ask ("orders over $1,000 today", "trial accounts that never connected") can become a check, and the alerts section below shows how one is built.
Best for: founders, ops and RevOps teams who want to know when a number in the database changes, without writing cron jobs or Grafana alert rules.
Pricing: create an account and try it on sample data for free. Pro is $20 per user per month, paid as $20 of credits per user that never expire, with scheduled workflows and webhooks included. Team is $50 per user per month with unlimited AI usage, shared dashboards and workflows (pricing, read 2026-11-17).
Limits: it does not track CPU, disk, replication lag or slow queries. Pair it with one of the tools below if you also need server health. See alerts and monitoring and the PostgreSQL to Slack alert setup.
2. Percona Monitoring and Management (PMM)
What it is: An open source monitoring and management tool for MySQL, PostgreSQL, MongoDB and the servers they run on (Percona).
What it does well: Query Analytics ranks every query by load and works the same way for all three engines, with explain plans and drill-down from fleet to a single query. For PostgreSQL it uses the pg_stat_monitor extension for deeper stats. Percona Alerting supports 15+ notification channels, and Percona Advisors scan for misconfigurations and security issues. PMM also schedules backups and point-in-time recovery for MySQL and MongoDB.
Best for: teams running a mix of MySQL, PostgreSQL and MongoDB who want one free tool for all three.
Pricing: free and open source; Percona sells support.
Limits: you host the PMM server and install a client on each database host. No SQL Server or Oracle.
3. pgwatch
What it is: A PostgreSQL-specific monitoring tool with Grafana dashboards. It started in 2016 (Kaarel Moppel) and the current v3 codebase was rewritten by Pavlo Golub (pgwatch docs).
What it does well: it covers almost every PostgreSQL metric out of the box (health checks, query performance, index usage, disk I/O, locks and waits) and also watches Patroni clusters, PgBouncer and PgPool poolers, and pgBackRest and WAL-G backups. You can add your own SQL-based metrics, which is the closest any of the free infrastructure tools get to data monitoring. A live demo runs at demo.pgwatch.com.
Best for: Postgres-only teams that want depth over breadth.
Pricing: free and open source; Cybertec sells 9-to-5 and 24/7 support.
Limits: PostgreSQL only, and you run the collector, the metrics store and Grafana.
4. Prometheus with postgres_exporter or mysqld_exporter, plus Grafana
What it is: The standard open source metrics stack. An exporter reads database stats and exposes them on an HTTP endpoint; Prometheus scrapes and stores them; Grafana draws dashboards and sends alerts.
What it does well: postgres_exporter is CI-tested on PostgreSQL 13 through 18, listens on port 9187 by default and has a multi-target /probe?target= endpoint, so one exporter can watch managed databases where you can't install a sidecar. mysqld_exporter supports MySQL 5.6 and later and MariaDB 10.3 and later.
# Run postgres_exporter in Docker, then check the metrics endpoint
docker run --net=host \
  -e DATA_SOURCE_USER=postgres -e DATA_SOURCE_PASS=password \
  quay.io/prometheuscommunity/postgres-exporter \
  --datasource.uri="localhost:5432/postgres?sslmode=disable"
curl "http://localhost:9187/metrics"
Best for: teams already running Prometheus for their apps.
Pricing: free and open source.
Limits: three components to run and maintain, and you write the alert rules yourself in PromQL, for example pg_up == 0 for a down instance.
5. Zabbix
What it is: An open source monitoring platform for servers, networks, applications and databases. Since version 7.0 it is released under AGPLv3; versions up to 6.4 were GPLv2 (Zabbix license).
What it does well: official PostgreSQL templates for Zabbix Zabbix agent, Zabbix agent 2 and ODBC across versions 7.0 to 8.0 (Zabbix PostgreSQL integration), plus event correlation that de-duplicates flapping alerts and groups cause and symptom events.
Best for: IT teams that already monitor servers and networks and want databases in the same console.
Pricing: free; Zabbix asks commercial users to buy support.
Limits: heavy for a single database; the setup is a server, a database for Zabbix itself, a frontend and agents.
6. Netdata
What it is: A monitoring agent with per-second metrics, dashboards and alerts out of the box (Netdata pricing).
What it does well: zero-config auto-detection across 800+ integrations, including PostgreSQL and MySQL collectors. Netdata states the agent uses about 5% CPU, 150 MB of RAM and 3 GB of disk for more than a year of retention.
Best for: a fast look at a database host with almost no setup.
Pricing: a free Community plan; Business starts at $7 per node.
Limits: good at host and engine metrics, light on per-query analysis compared with PMM or pgwatch.
7. Grafana Cloud Free
What it is: Hosted Grafana, Prometheus-compatible metrics and Loki logs, so you skip running the stack yourself (Grafana pricing).
What it does well: the free tier includes all Grafana Cloud services with 10,000 active metric series and 50 GB of ingested logs per month, no credit card required; Pro metrics start at $6.50 per 1,000 series above that. Point a postgres_exporter at it and you get the stack from option 4 without hosting it.
Pricing: $0 forever within limits; Pro starts at $19 per month plus usage, with 13 months of metrics retention.
Limits: 14 days of retention on the free tier, and the exporters still run on your side.
Can I monitor PostgreSQL and MySQL with one tool?
Yes. PMM, Zabbix, Netdata and Prometheus with Grafana all monitor PostgreSQL and MySQL from one dashboard; PMM adds MongoDB with the same Query Analytics view. pgwatch is the exception: PostgreSQL only. For alerts on the data in both, AI for Database connects to PostgreSQL and MySQL (and SQL Server, MongoDB, BigQuery and others) in one workspace.
How do I get alerts when a business number changes?
You get alerts on data changes in three ways:
- Database triggers: a trigger calls a function on INSERT or UPDATE. Fast, but it needs DBA access and code inside the database.
- A scheduled query plus a script: cron runs a SQL check and posts to Slack. Works, but someone has to maintain it. Our guide to scheduling a Postgres query shows the options.
- An action workflow in AI for Database: write the condition in plain English ("when daily signups drop below 50"), pick the action (Slack message, email or webhook URL), and it checks your database on its schedule. No triggers, stored procedures or DBA access.
-- The kind of check a data alert runs: signups today vs the threshold
SELECT count(*) AS signups_today
FROM users
WHERE created_at >= date_trunc('day', now());
-- Alert when signups_today < 50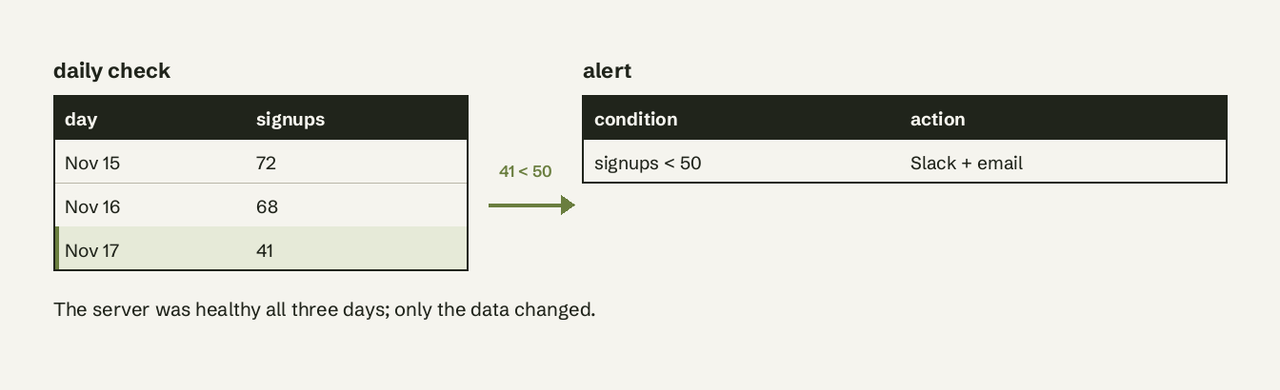
How to choose
- You need to know when a business number changes: AI for Database. None of the infrastructure tools read your rows by default.
- Mixed MySQL, PostgreSQL and MongoDB, and you want query analysis: PMM.
- PostgreSQL only, maximum depth: pgwatch.
- You already run Prometheus: add the exporters, or use Grafana Cloud Free to skip hosting.
- IT team with servers and networks to watch too: Zabbix.
- Quick look at one box today: Netdata.
Most teams end up with two: one tool for server and query health, and AI for Database for the numbers the business cares about. If you also need a live view of those numbers, see our guide to a company metrics dashboard.
Frequently Asked Questions
What are the best free database monitoring tools?
Percona Monitoring and Management, pgwatch, Prometheus with postgres_exporter or mysqld_exporter and Grafana, Zabbix and Netdata are the main free tools for server and query monitoring; Grafana Cloud has a free hosted tier. AI for Database adds alerts on the business data itself, with a free start on sample data.
Is there a free open source database monitoring tool for PostgreSQL?
Yes. pgwatch is built only for PostgreSQL; PMM, Zabbix, Netdata and postgres_exporter also support it. All are open source.
What should I monitor in a database?
Watch connections, CPU, memory, disk space and I/O, replication lag, slow queries (from pg_stat_statements in PostgreSQL) and lock waits. Then add business checks like daily signups or failed payments, because a healthy server can hold falling numbers.
Does Grafana monitor databases on its own?
No. Grafana draws dashboards and sends alerts, but it needs a data source such as Prometheus fed by an exporter, or a direct SQL data source.
How do I monitor slow queries for free?
In PostgreSQL enable pg_stat_statements and sort by total_exec_time or mean_exec_time; PMM Query Analytics and pgwatch show the same data in dashboards. For the full walkthrough of a plan, see [PostgreSQL EXPLAIN](https://www.aifordatabase.com/blog/postgresql-explain-query/). Want an alert the moment your data changes, not just your server? Try AI for Database free at aifordatabase.com ([sign up](https://app.aifordatabase.com/signup)).
- HOW TO MONITOR YOUR SAAS METRICS DIRECTLY FROM YOUR DATABASE →
- AI AGENT DATABASE MONITORING: 5 METRICS TO TRACK (2026) →
- CONNECT LANGGRAPH TO YOUR DATABASE WITHOUT SQL (2026) →
- AI DATABASE SOLUTIONS IN 2026: 8 TOOLS COMPARED (AND WHEN TO USE EACH) →
- AI SQL QUERY GENERATOR: 5 OPTIONS COMPARED (2026) →
- THE COMPLETE GUIDE TO DATABASE MONITORING AND ALERTS →